Class A Mall REITs: Misunderstood and Mispriced | February 2017
February 1, 2017
Mall REITs have suffered from a steady drumbeat of negative news for several years now given the shift toward e-commerce at the expense of ‘bricks and mortar’ real estate. Recently announced plans to close additional stores at Macy’s (NYSE: M) and Sears (NASDAQ: SHLD) have added fuel to the fire and pushed mall REITs further out of favor than ever before. Their recent performance, especially when compared to industrial REITs, implies that e-commerce has already made the mall obsolete.

Industrial REITs, the primary beneficiaries of e-commerce, led all REIT sectors in 2016, outperforming the MSCI US REIT Index (Bloomberg: RMS G) by 2,200 bps, as measured by the FTSE NAREIT Industrial Index (Bloomberg: FNINDTR). The FTSE NAREIT Regional Mall Index (Bloomberg: FNMALTR), by contrast, was one of only two REIT sectors with a negative total return in 2016. Mall REITs finished the year 3,600 bps behind industrial REITs, the largest underperformance since 1997.
We believe that high quality Class A mall REITs offer the best risk-adjusted returns currently available to investors in US real estate, public or private. This is a result of several years of this underperformance driven by the public market’s fundamental misunderstanding of department store and e-commerce risks, which are actually massive opportunities for high quality, well-capitalized Class A mall REITs. While we concede that these risks will adversely affect Class B-minus or lower mall owners, the shuttering of these properties and the minimal planned construction of new Class A properties will cause the mall sector to be the only type of real estate where existing supply will actually decline over the next decade.
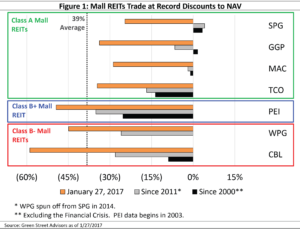
Mall REITs were trading at an average discount to NAV of 39% as of January 27, as shown in Figure 1. This discount is particularly unwarranted for Class A mall REITs, who are also benefiting from an environment of growing retail sales, which should result in strong same store cash flow growth and extremely attractive reinvestment opportunities for them. If discounts continue, it may also attract the interest of real estate private equity and buyout funds, who are sitting on record amounts of dry powder.
Department Stores Out of Style
Few retailers have lost as much in-store sales to e-commerce as middle-market department stores. Since 2013, Macy’s, JCPenney (NYSE: JCP), Dillard’s (NYSE: DDS), Sears, and Kohl’s (NYSE: KSS) have closed over 20% of their US locations, vacating their lowest sales/square foot (sqft) stores, which tend to anchor Class B-minus or lower malls. Many of these malls are no longer viable without demand from replacement tenants. Invariably, the business press has focused on Class B-minus and lower malls in its narrative of the death of the American mall. However, that is not the full story.
Unlike Class B-minus and lower malls, Class A malls boast record high rents and occupancy levels, which have translated into all-time high private market values. Similarly, Class A malls are actually excited when a weak department store wants to get out of its lease or sell its box, as these have become exponentially more valuable real estate since the mall was originally opened.
For most mall owners, department stores were initially viewed as a traffic generator, gaining them favorable occupancy terms in exchange for providing an ecosystem that creates demand for higher priced small shop space. Despite occupying 60-70% of mall sqft, anchors contribute 10% or less to a mall’s net operating income (or NOI)!
No Class B-Minus or C, No Problem
Class A malls have not suffered from department store vacancies because their ecosystems, locations, and tenant rosters cause them to have a waiting list of new tenants wanting to lease space in them. When malls were first developed, department stores negotiated from a position of strength. Today, Class A mall landlords have the negotiating advantage as such malls’ ecosystems are less dependent upon department store anchors. Many of the malls are now surrounded by high-end residential, hotel, and office properties that further enhance the mall experience. With such strong demand, the landlord can replace the tenant with a higher performing anchor at a higher rent, which can generate more traffic for the other retailers. Additionally, if they can subdivide the anchor’s space and re-lease it to multiple tenants at a higher rental rate, it is incredibly profitable.

Seritage Growth Properties (NYSE: SRG), into which Sears spun off 254 of its owned and leased stores in June 2015, was formed with this specific purpose. Seritage set out to close its underperforming Sears and Kmart properties, sub-divide them, and re-lease them to higher paying tenants. SRG’s disclosures of recent developments give investors an insight into just how profitable this strategy can be. Through December 31, 2016, SRG has repurposed and re-leased 2 million sqft of Sears space at an average rental rate of $18.62/sqft, over 4.4 times the $4.20/sqft average rate Sears was paying previously. The company estimates an unlevered yield of 12% on $400 million of redevelopment thus far, which would grow NAV by $7/share assuming an exit cap rate of 6.0%.
The Class A mall REIT that has most aggressively pursued this strategy is GGP Inc. (NYSE: GGP). Since 2011, GGP has re-leased or redeveloped 91 of the 95 department stores or big box anchors that have vacated their spaces at a total cost of $1.1 billion. These projects generated an 11% yield, almost twice GGP’s 5.8% implied cap rate on January 27, 2017. The replacement tenants include 18 new department store anchors, 14 entertainment venues, 10 sporting goods stores, 5 grocery stores, 3 fitness centers, and hundreds of new small store tenants. In addition to the extremely profitable direct results from the redevelopment of anchors, GGP has benefited from the enhanced ecosystem provided by the new traffic drivers.
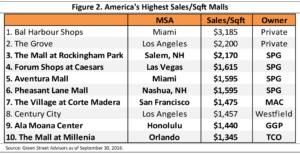
GGP’s biggest redevelopment program has been at Ala Moana Center in Honolulu. Ala Moana is a huge 2.4 million sqft mall that is widely considered to be the most valuable mall in the US, generating the ninth highest sales/sqft in 2016 (see Figure 2). It is the main hub of Honolulu’s mass transit system, its Centerstage is one of Hawaii’s most popular public venues, and it is adjacent to Ala Moana Beach Park, all of which make the center a must-see destination for tourists, and even locals.
In 2013, GGP bought Sears out of a 300,000 sqft lease at Ala Moana for $200 million, then spent an additional $300 million to redevelop the space by replacing Sears with Bloomingdales and dozens of small stores. GGP estimates this increased the value of Ala Moana by over $1 billion, assuming a 4% cap rate. The mall has made the area so attractive that GGP is building its second condominium tower adjacent to the property, and GGP spinout Howard Hughes Corporation (NYSE: HHC) has pre-sold four condo towers next door, with plans for an additional 12 towers. A strong ecosystem indeed!
Who’s Closing?
Reports of closing malls and subsequent underperformance by Simon Property Group (NYSE: SPG), GGP, and Macerich (NYSE: MAC) suggests that such REITs hold similar properties that will also close. In fact, that could not be further from the truth. SPG, GGP, and MAC have only 1.5%, 2%, and 4% of their portfolios in Class B-minus or lower malls, respectively. While it is undeniable that many Class B-minus or lower malls have been given back to lenders as their values declined to less than the property-level debt, there has not been enough media coverage of the record values and rents being attained by Class A malls.
According to Green Street Advisors, the US has about 1,100 malls, of which 29% are Class A, 29% are Class B-plus or B, 10% are Class B-minus, and 32% are Class C or lower. Figure 3 breaks out gross asset value by class for the US mall universe and each of the mall REITs. On this gross asset value basis, Green Street estimates that 77% of US mall value comes from Class A malls, 16% comes from Class B-plus or B malls, 3% comes from Class B-minus malls, and 4% comes from Class C or lower malls.

Class A mall owners have been proactive in improving the shopping experience by investing large sums to enhance the physical layout, diversifying the tenant mix, and enhancing the retail experience with more dining and entertainment options. Typically, Class A malls are located in high income and high population density trade areas or tourist destinations. Ecosystems at these malls create a positive reinforcement loop, as the best retailers want to have a presence there. This allows such tenants to stay relevant to consumers and increases overall mall traffic, which in turn makes it more attractive to other high quality retailers, and encourages the landlord to reinvest in the property. It is not a coincidence that Apple (NASDAQ: AAPL) or Tesla (NASDAQ: TSLA), the two highest sales/sqft tenants today, happen to occupy space in 78 of the top 100 malls and 67% of all US REIT-owned Class A malls.
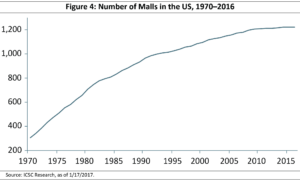
We estimate that continued growth in e-commerce market share will force 10-15% of existing US malls to close or be repurposed over the next decade. The vast majority of these will be Class C or lower malls, with some Class B-minus mall closures likely. We are unaware of any Class A malls that have ever closed, and are confident that this will be true for the next decade. With closings and little new development on the horizon, the total supply of malls has peaked, as shown in Figure 4. The surviving malls stand to benefit from lower competition, especially in an environment of growing retail sales.
One prominent example of this is Valley View Center in Dallas. First developed in 1973, the one million sqft Class B mall initially thrived as an affordable alternative to nearby NorthPark Center, Dallas’s best and oldest mall. In the 1980’s, the upscale Galleria Dallas mall was built less than half a mile away from Valley View. Over the next 20 years, it gradually lost most of its customers, small tenants, and even large anchors to the Galleria and NorthPark. The mall effectively closed in 2013 when JC Penney vacated its space, leaving only Sears and a movie theatre as semi-freestanding ‘anchors’ to the property. In late 2016, Valley View’s owner began demolishing the property and plans to replace it with a large mixed-used development.
Mismarked Inventory
Current valuations of Class A mall REITs also provide a large margin of safety and an excellent risk/reward ratio. As Figure 1 shows, all mall REITs trade much further below their NAV than they have on average since 2011 (post Financial Crisis, gray bar) and over the long term (since 2000 excluding the Financial Crisis, black bar).
Class B-minus and lower mall REITs may deserve significant NAV discounts as recent private market transactions have surprised most analysts to the downside, indicating cap rates could be higher than those used in current NAV estimates. However, the dramatic deviations from historical averages seen in Class A mall REITs are entirely unwarranted. As shown in Figure 3, even if we assume that all Class B and C malls for Taubman Centers (NYSE: TCO), SPG, MAC, and GGP are worthless and there is no debt on the properties, they would still be trading at significant discounts to NAV.

The Class A mall REIT discount is unwarranted based on where individual assets are trading on the private market. For example, as far back as January 2014 TCO sold a 49% interest in International Plaza in Tampa for a 4.2% cap rate. In 2015, an Australian pension fund paid a 3.8% cap rate for a 25% interest in Ala Moana Center. Most recently, TIAA-CREF paid GGP a 3.7% cap rate for a 50% interest in Fashion Show Mall in Las Vegas in 2016.
The NAV discount is even more unwarranted when looking at future NAV growth. For the next three years, we project Class A mall REITs to produce same store NOI growth of more than 3% per year. By combining the same store NOI growth with value creation from redevelopment programs of 1% of the portfolio per year, we estimate each company will grow NAV/share at 5% or more annually over the next three years. Therefore, even if we assume that NAV discounts remain at today’s unreasonable levels, Class A mall REIT prices would still be 16% higher than they are today. This is one of the largest margins of safety available to US real estate investors, public or private.
Public investors have thrown the baby out with the bath water and are pricing in a doomsday scenario for Class A mall REITs that own great properties and are led by proven management teams. Retailing is a constantly evolving industry and we are currently witnessing a welcome reduction in retail space in the United States, in part due to e-commerce but also due to changes in consumer tastes and buying habits.
The owners of Class A malls have been the most proactive in responding to these changes by investing significant dollars to keep the malls vital to retailers in an “omni-channel” world. The future looks even brighter as Class A mall REITs stand to benefit from the decline of the department store, both from redevelopment and less competition as a result of mall closures. Finally, a deep buyer pool has been consistently paying record-low cap rates for Class A malls given their scarcity and historically strong cash flow growth. As REITs own over 70% of all US Class A malls, these companies should continue to be undervalued until the public market recognizes their present margins of safety and bright futures.
Parker Rhea, prhea@chiltonreit.com, (713) 243-3211
Matthew R. Werner, CFA, mwerner@chiltonreit.com, (713) 243-3234
Bruce G. Garrison, CFA, bgarrison@chiltonreit.com, (713) 243-3233
Blane T. Cheatham, bcheatham@chiltonreit.com, (713) 243-3266
RMS: 1904 (1.31.2017) vs. 1904 (12.31.2016) vs. 346 (3.6.2009) and 1330 (2.7.2007)
Previous editions of the Chilton Capital REIT Outlook are available at www.chiltonreit.com/reit-outlook.html.
An investment cannot be made directly in an index. The funds consist of securities which vary significantly from those in the benchmark indexes listed above and performance calculation methods may not be entirely comparable. Accordingly, comparing results shown to those of such indexes may be of limited use.
The information contained herein should be considered to be current only as of the date indicated, and we do not undertake any obligation to update the information contained herein in light of later circumstances or events. This publication may contain forward looking statements and projections that are based on the current beliefs and assumptions of Chilton Capital Management and on information currently available that we believe to be reasonable, however, such statements necessarily involve risks, uncertainties and assumptions, and prospective investors may not put undue reliance on any of these statements. This communication is provided for informational purposes only and does not constitute an offer or a solicitation to buy, hold, or sell an interest in any Chilton investment or any other security.
for more info on our strategy
go now →
for more info on our strategy
go now →
VIEW CHILTON'S LATEST
Media Features
go now →
Contact Us
READ THE LATEST
REIT Outlook
go now →
disclaimers
terms & conditions & FORM ADV
SITE CREDIT
Navigate
HOME
TEAM
REITS 101
Approach
OUTLOOKS
media
Contact
back to top
VISIT CHILTON CAPITAL MANAGEMENT
This property and any marketing on the property are provided by Chilton Capital Management, LLC and their affiliates (together, "Chilton"). Investment advisory services are provided by Chilton, an investment adviser registered with the SEC. Please be aware that registration with the SEC does not in any way constitute an endorsement by the SEC of an investment adviser’s skill or expertise. Further, registration does not imply or guarantee that a registered adviser has achieved a certain level of skill, competency, sophistication, expertise or training in providing advisory services to its advisory clients. Please consider your objectives before investing. A diversified portfolio does not ensure a profit or protect against a loss. Past performance does not guarantee future results. Investment outcomes, simulations, and projections are forward-looking statements and hypothetical in nature. Neither this website nor any of its contents shall constitute an offer, solicitation, or advice to buy or sell securities in any jurisdictions where Chilton is not registered. Any information provided prior to opening an advisory account is on the basis that it will not constitute investment advice and that we are not a fiduciary to any person by reason of providing such information. Any descriptions involving investment process, portfolio construction or characteristics, investment strategies, research methodology or analysis, statistical analysis, goals, risk management are preliminary, provided for illustration purposes only, and are not complete and will not apply in all situations. The content herein may be changed at any time in our discretion . Performance targets or objectives should not be relied upon as an indication of actual or projected future performance. Investment products and investments in securities are: NOT FDIC INSURED • NOT A DEPOSIT OR OTHER OBLIGATION OF,OR GUARANTEED BY A BANK • SUBJECT TO INVESTMENT RISKS, INCLUDING POSSIBLE LOSS OF THE PRINCIPAL AMOUNT INVESTED. Investing in securities involves risks, and there is always the potential of losing money when you invest in securities including possible loss of the principal amount invested. Before investing, consider your investment objectives and our fees and expenses. Our advisory services are designed to assist clients in achieving discrete financial goals. They are not intended to provide tax advice, nor financial planning with respect to every aspect of a client’s financial situation, and do not incorporate specific investments that clients hold elsewhere. Prospective and current clients should consult their own tax and legal advisers and financial planners. For more details, see links below to CRS (Part 3 of Form ADV) for natural person clients; Part 2A and 2B of Form ADV for all clients regarding important disclosures.