Self Storage: Peak New Supply, Peak Valuation? | August 2018
August 1, 2018
Self storage is a niche property type within commercial real estate. Self storage demand benefits from all aspects of life—in good times due to home renovations, new jobs/relocation, and summertime storage between college semesters, but also during difficult times such as dealing with a divorce, the passing of a family member, and job dislocation. The most common unit is 10 x 10 square feet, which rents for $142 a month (climate-controlled) and $126 a month (non-climate-controlled) on average, according to Union Realtime and the Self Storage Almanac, and has an average length of stay around 14 months (which is much longer than many tenants originally anticipate to stay). These characteristics have made self storage an attractive sector regardless of the economic climate. Recently, the sector has caught a bid due to its short-term lease (one month) structure, which gives owners the ability to mark rents quickly, a desirable attribute while interest rates are rising. Year to date, the US 10 year Treasury yield has increased 56 basis points (bps) to 2.96% as of July 31, 2018. Over the same period, the self storage sector (BB:BBREPBST) is the second best performing property type with a total return of +7.3%.
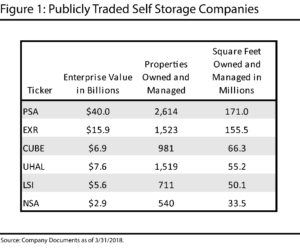
According to the 2018 Self Storage Almanac, the self storage industry as a whole stands at 44,149 facilities encompassing 2.3 billion square feet of leasable area. Unlike many other property types, ownership within the self storage sector is top-heavy with only a handful of large players (Figure 1). The six major publicly traded self storage companies (Public Storage (NYSE: PSA), Extra Space Storage (NYSE: PSA), Cubesmart (NYSE: CUBE), U-Haul (NYSE: UHAL), Life Storage (NYSE: LSI), and National Storage Affiliates (NYSE: NSA)) are also the largest six operators in the U.S. Together, they make up 20.9% of the industry’s square footage and 17.0% of the facilities. Outside of the top six operators, the next 94 only comprise 8% of the industry. To highlight the disparity, the number 99 and 100 ranked operators owned only one and three properties, respectively.

The predominantly mom-and-pop composition of the industry has a few important implications for the sector. First, there is an obvious opportunity for consolidation within the space. Since 2013, the REITs have taken full advantage by acquiring over $13.3 billion in assets. Second, a large amount of unsophisticated competition can lead to irrational decision-making with negative implications for the sector. Today’s “excess” supply environment is an example.
Peak Development?
2018 will be the seventh consecutive year of accelerating new supply growth for the self storage sector, and many industry experts are not expecting a significant deceleration until at least 2020. By then, the experts predict rising construction costs, higher interest rates, and slowing rent growth will bring about a slowdown in construction. These inputs shouldmake deals relatively more difficult to pencil, but we believe it may still be too early to call a peak in the development cycle. Construction takes about five quarters to complete, which means a facility that begins construction today could still be included in 2019’s supply, leaving plenty of time for increases in estimates for 2020 deliveries. In addition, there is still 5.9% of existing stock in the permitting and planning stages (as compared to 3.5% currently under construction), according to Union Realtime (URT), an industry data research firm.
While there is always a possibility that 2020 projected deliveries now in the planning stage could end up getting shelved or delayed, we doubt it! Despite the aforementioned negative factors, Jernigan Capital (NYSE: JCAP), a self storage development lender,projects that unlevered returns are in the mid to high teens. This compares to required returns of about 7.0% for acquisitions in the private market.
Availability of capital appears plentiful as nontraditional lenders such as debt funds and mortgage REITs have filled the gaps left by traditional lenders such as commercial banks. In 2017, nontraditional lending accounted for 15% of all construction lending according to Real Capital Analytics. Additionally, Green Street Advisors estimates that nontraditional lending volumes could match the levels of life insurance companies and Commercial Mortgage Backed Securities (CMBS) in 2018. These “lenders” are not regulated like traditional banks and typically target higher yields.
Small business loans are another source of capital many of the local developers and owners of self storage are using at an increasing rate. In 2017, these programs approved $498 million in self storage loans, a 55% increase from the prior year. Additionally, $83 million in loans have been approved through the first quarter of 2018, implying another $400+ million year of self storage small business loans.
Self storage industry veteran and current Principal at Charmel Storage Capital Hugh Horne summed up the current development environment best. When asked why “now” is a good time to develop self storage, he responded, “Because always is a good time.”
Development Impact
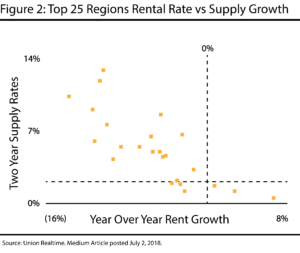
The elevated levels of self storage development are beginning to take a toll on rent growth, and the sector’s unique lease-up process does not help. Unlike most commercial real estate such as office, retail, and industrial where pre-leasing is common, a self storage facility is typically built on pure speculation and has a much longer stabilization period of three to four years. This lease-up dynamic means a competitive new property can have a longer impact on a surrounding property’s rent trajectory than in other property types. Union Realtime’s market research shows just how painful elevated supply levels can be on market rent growth (Figure 2). Their data shows a clear negative correlation between levels of supply and rent growth. Only three of the top 25 regions have realized positive rental rate growth and, unsurprisingly, all three have endured minimum levels of new supply.

Looking into 2019, forecasted supply levels are expected to pressure rent growth particularly on new tenants. Union Realtime forecasts that 12% of total supply will be in lease-up during 2019 (based on a three year lease-up period). Therefore, in order to drive total revenue growth, companies will be forced to push rent on existing tenants who have already been receiving high single digit rent increases annually.
Third Party Management
Despite the difficult near term operating environment, the REITs are using scale to their advantage. The internet has played a major role in helping their ability to attract new customers since they can afford the related costs of the search engines. Additionally, they maintain call centers 24/7 to assist prospective customers and handle routine renewals. As a result, the small players in the industry are at a significant disadvantage, which has opened the door for the REITs to earn additional income through third party management platforms where the REITs operate other self storage owners’ properties under the REIT’s brand.
Since 2015, the REITs have grown their third party management portfolios by 75%, including two recent entrants into the third party management space: LSI and PSA. Between the platforms, there are differences in the fees charged, how revenue is shared and costs are allocated, and how the properties are marketed.
How tenant insurance will be split is another negotiation point between the owner and third party manager. Tenant insurance is highly profitable with margins of about 80% and it currently accounts for about 10% of REIT NOI (or Net Operating Income). EXR is typically referenced as the most expensive and retains all tenant insurance proceeds, while PSA plans to undercut its competition and will pass through $6 per tenant per month to the owner.
Though there are slight differences, all third party managers allow the owner to access a top tier operating management team, complex and proprietary revenue management systems, and targeted web and mobile advertising as the owner’s property is seamlessly integrated into the REIT’s portfolio. Often, the property manager is not even aware of whether the property is REIT owned or managed. As of 1Q 2018, third party managed properties make up 38%, 30%, 7%, and 0% of CUBE’s, EXR’s, LSI’s, and PSA’s total owned and managed portfolios, respectively, and account for about 3% of revenues.
Outside of the immediate benefit of management fees, third party management provides the REITs a pipeline for future acquisitions. Pricing in the open market is currently very expensive, and managed properties give the REITs an opportunity to have an inside shot at an off-market transaction with less operational risk.
Life Storage Case Study
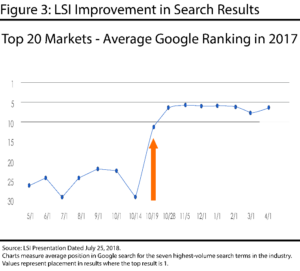
Technology is one of the largest competitive advantages of the self storage REITs; however, it was actually detrimental to Life Storage’s performance during the rebranding from Uncle Bob’s in 2016. In the process of implementing the name change, the company lost some of its name recognition status within the Google search algorithm. This caused LSI’s properties to fall off the first page of a web search. As a result, web traffic and rentals fell, and the company struggled to meet earnings estimates. On October 19, 2017, LSI regained its search status (Figure 3), which not only brought back the traffic it had lost but also incremental demand from its new and improved brand. This circumstance, though negative, actually gave investors a glimpse at how crucial the REIT platforms are to their outperformance. LSI’s fully operational and integrated platform was worth about 75 to 100 basis points in revenue growth.

Since the company’s rebranding, management has continued to use technology to enhance its operations. On May 31, 2018, LSI announced a partnership with Union Realtime. URT will provide property-level rental rate data and also track the locations of new self storage development. The partnership will help LSI to better understand its future competition as well as with acquisition underwriting.
LSI is also creating its own technology. Rent Now is a mobile technology LSI recently piloted in Buffalo to meet the changing needs of customers who desire self-service, including Millennials. Rent Now allows a prospective customer to completely bypass the front counter, and go through the entire rental process from his phone. After reserving a unit, the customer is sent a gate code and step by step directions to his unit. The customer will find a welcome bag inside the unit with additional information. The pilot began in early June and LSI is excited by early adoption rates. LSI plans to roll the program out to ten additional markets (142 locations) starting in August.
Warehouse Anywhere is another technology platform LSI is using to expand its outreach to a wider audience. Warehouse Anywhere is tailored to corporate account business. The program first started almost a decade ago when Life Storage saw an opportunity to gain a larger share of corporate business by enticing them with discounted rates in anticipation that they would be longer, more stable tenants. However, LSI realized this could be a much larger opportunity that could command premium rents (and fee income) rather than discounts with the help of technology.
Warehouse Anywhere consists of two components: corporate storage management and inventory management. Under storage management, LSI is able to centralize the billing for corporate clients’ storage needs across the country, reducing client bills from hundreds to one. Additionally, LSI’s entire portfolio is available to the client for future storage needs in any location they may desire. If LSI does not have a property within five miles of the client’s desired location, LSI finds a unit at a preferred partner’s facility and earns a commission on the rent.
The second, and more intriguing aspect of the business to us, is inventory management. In 2016, Life Storage brought an inventory tracking system using RFID (radio frequency identification) technology into Warehouse Anywhere. This technology allows corporate clients to monitor products coming into and out of its units. LSI and its preferred network provide the units (at a premium rental rate) and the inventory management tech overlay, while the delivery of product (and the cost) is borne by other parties. We believe this could give LSI a “last mile” e-commerce component to their business as it continues to gain traction with clients.
Warehouse Anywhere currently accounts for about $2.5 million in annual fee revenue for Life Storage (<1% of total revenue), not including any rental income, or fees from the inventory management overlay. It is still relatively early in the implementation of this particular tech initiative, but we applaud the company for innovation in a business where scale and technology provide a distinct competitive advantage.
Current Valuation
As of July 12, 2018, the self storage sector (on a market weighted basis) traded at a 22.4x 2018 AFFO multiple, a 9% premium to its 10 year average and 22% premium to the REIT weighted average multiple. Additionally, self storage traded at a 16% premium to NAV, which compared to a 0.2% premium for the overall sector. In our view, the premium valuations are unjustified when considering the difficult operating environment the REITs could be facing over the next year.

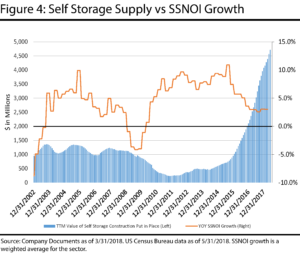
The period from late 2010 to mid-2016 was the last time the self storage sector traded at today’s valuations. During that time, the economy was gaining steam, construction was at multi-decade lows, the sector was experiencing cap rate compression, and same store NOI growth (or SSNOI, defined as rental revenue minus property operating expenses) was accelerating to record highs. In fact, SSNOI growth accelerated from -4.0% in 4Q 2009 to +10.9% in 4Q 2015 (Figure 4). In addition, SSNOI growth had the benefit of an increase in occupancy of over 1,000 basis points. Today, the set up for the sector is much different. Construction (measured by value put in place) is at a historical high, cap rates are at record lows making it difficult for the REITs to grow in scale, and occupancy is at an all-time high. We believe that better value and growth opportunities can be found in other sectors.
Parker Rhea, prhea@chiltonreit.com, (713) 243-3211
Matthew R. Werner, CFA, mwerner@chiltonreit.com, (713) 243-3234
Bruce G. Garrison, CFA, bgarrison@chiltonreit.com, (713) 243-3233
Blane T. Cheatham, bcheatham@chiltonreit.com, (713) 243-3266
RMS: 1839 (3.31.2018) vs 2000 (12.31.2017) vs. 346 (3.6.2009) and 1330 (2.7.2007)
Previous editions of the Chilton Capital REIT Outlook are available at www.chiltonreit.com/reit-outlook.html.
An investment cannot be made directly in an index. The funds consist of securities which vary significantly from those in the benchmark indexes listed above and performance calculation methods may not be entirely comparable. Accordingly, comparing results shown to those of such indexes may be of limited use.
The information contained herein should be considered to be current only as of the date indicated, and we do not undertake any obligation to update the information contained herein in light of later circumstances or events. This publication may contain forward looking statements and projections that are based on the current beliefs and assumptions of Chilton Capital Management and on information currently available that we believe to be reasonable, however, such statements necessarily involve risks, uncertainties and assumptions, and prospective investors may not put undue reliance on any of these statements. This communication is provided for informational purposes only and does not constitute an offer or a solicitation to buy, hold, or sell an interest in any Chilton investment or any other security.
for more info on our strategy
go now →
for more info on our strategy
go now →
VIEW CHILTON'S LATEST
Media Features
go now →
Contact Us
READ THE LATEST
REIT Outlook
go now →
disclaimers
terms & conditions & FORM ADV
SITE CREDIT
Navigate
HOME
TEAM
REITS 101
Approach
OUTLOOKS
media
Contact
back to top
VISIT CHILTON CAPITAL MANAGEMENT
This property and any marketing on the property are provided by Chilton Capital Management, LLC and their affiliates (together, "Chilton"). Investment advisory services are provided by Chilton, an investment adviser registered with the SEC. Please be aware that registration with the SEC does not in any way constitute an endorsement by the SEC of an investment adviser’s skill or expertise. Further, registration does not imply or guarantee that a registered adviser has achieved a certain level of skill, competency, sophistication, expertise or training in providing advisory services to its advisory clients. Please consider your objectives before investing. A diversified portfolio does not ensure a profit or protect against a loss. Past performance does not guarantee future results. Investment outcomes, simulations, and projections are forward-looking statements and hypothetical in nature. Neither this website nor any of its contents shall constitute an offer, solicitation, or advice to buy or sell securities in any jurisdictions where Chilton is not registered. Any information provided prior to opening an advisory account is on the basis that it will not constitute investment advice and that we are not a fiduciary to any person by reason of providing such information. Any descriptions involving investment process, portfolio construction or characteristics, investment strategies, research methodology or analysis, statistical analysis, goals, risk management are preliminary, provided for illustration purposes only, and are not complete and will not apply in all situations. The content herein may be changed at any time in our discretion . Performance targets or objectives should not be relied upon as an indication of actual or projected future performance. Investment products and investments in securities are: NOT FDIC INSURED • NOT A DEPOSIT OR OTHER OBLIGATION OF,OR GUARANTEED BY A BANK • SUBJECT TO INVESTMENT RISKS, INCLUDING POSSIBLE LOSS OF THE PRINCIPAL AMOUNT INVESTED. Investing in securities involves risks, and there is always the potential of losing money when you invest in securities including possible loss of the principal amount invested. Before investing, consider your investment objectives and our fees and expenses. Our advisory services are designed to assist clients in achieving discrete financial goals. They are not intended to provide tax advice, nor financial planning with respect to every aspect of a client’s financial situation, and do not incorporate specific investments that clients hold elsewhere. Prospective and current clients should consult their own tax and legal advisers and financial planners. For more details, see links below to CRS (Part 3 of Form ADV) for natural person clients; Part 2A and 2B of Form ADV for all clients regarding important disclosures.