REITs Are a Natural Hedge Against Trade Risk | September 2018
September 1, 2018
US REITs are better known for being an inflation hedge, but investors often overlook their proven ability to hedge against international trade and currency risks. As of August 31, President Donald Trump has slapped nearly $30 billion of tariffs on $120 billion of US imported goods, and he has threatened an additional $170 billion of tariffs on $860 billion more. $980 billion represents 41% of the $2.4 trillion of goods that the US imported in 2017, and 48% of imports from our four largest trade partners: the EU, China, Canada, and Mexico. Understandably, this has made some equity investors nervous. While we believe a full-blown trade war will be avoided, we are confident that the vast majority of REITs would outperform the S&P 500 were one to occur.
Should tensions continue to rise, we believe REITs could outpace the S&P 500 by an even larger margin today than they have historically, as even global and industrial REITs are currently more consumption-facing and driven by durable secular shifts in technology than ever before. By contrast, US large-cap equity indexes have more exposure to international trade and currency risks than they have since World War II.
How We Got Here: US Trade Policy
Tariffs have historically been brandished more as political weapons than economic tools. In today’s politically-charged environment, it is more important than ever for investors to put down their political glasses when approaching these issues. It also must be noted that US trade policy is very much a work in progress, so investors should be careful not to assign too much permanence to any one statement by any of the parties involved. However, the mere perception of escalating trade issues can have and has had an effect on stock prices over the short term, which is why we attempt to explore the topic.
In February 2016, President Obama made trade policy news by recommending the Trans-Pacific Partnership (TPP), but it was candidate Donald Trump who put it on the front page during his historic 2016 presidential campaign. On his first day in office, President Trump formally terminated US involvement in TPP, and over the rest of 2017 he set in motion the slow but steady process needed to put tariffs on over 10,000 types of US imports, including washing machines, solar panels, foreign cars and car parts, steel, aluminum, and Canadian softwood lumber. Even more importantly, he followed through on his campaign promise and notified US trade partners that he would be renegotiating NAFTA, CAFTA-DR, and the WTO’s GATT, shifting the US from its post-World War II multilateral rounds approach to a series of bilateral agreements.

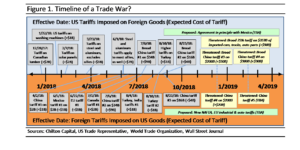
Figure 1 picks up at the end of 2017, when Trump’s trade policies began to take effect. Existing tariffs are shown with solid lines pointing to details on their effective date, description, and expected cost (tariff rate times value of goods subject to tariff equals expected cost), shown in parentheses. Threatened future tariffs are shown with hashed lines to the dates most analysts expect them to occur. These events have been widely covered in the press, but predictions regarding President Trump have been famously incorrect in the past. We would caution investors to focus on effective dates of detailed written policy, as these should be the most indicative of long-term policy goals.
Over this entire period, REITs consistently outperformed the S&P 500 on days when tariffs dominated the news, causing trade-sensitive companies like Boeing (NYSE: BA) and Caterpillar (NYSE: CAT) to sell off. Since January 1, 2016, BA and CAT both fell by 2% or more on 21 separate days. REITs outperformed the S&P 500 on 19 of those 21 days by an average of 107 basis points per day. REITs also outperformed on 8 of the 9 days where BA and CAT both fell by at least 3%, beating the S&P 500 by an average of 89 bps per day.
Exposure to a Trade War
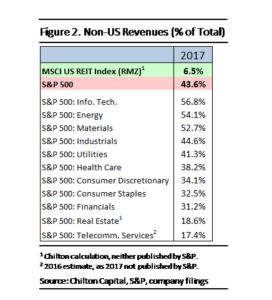
While only 23 of the companies in the S&P 500 are headquartered outside of the US, S&P estimates that 43.6% of all S&P 500 revenues come from outside the United States. Most Wall Street research firms believe that a trade war would reduce S&P 500 EPS by 1-5% and P/E multiples of less than 0.5-1.0x, for a total decline of 4-10%. Of the large banks, UBS has the most pessimistic analysis, forecasting two different scenarios where S&P 500 EPS shrinks by 6% or 15%, P/E ratios fall by 0.9x or 1.4x, and total returns decline by 10% or 21%, respectively.

Figure 2 also shows the exposure to foreign markets by sector, including Real Estate at the low end. Notably, UBS expects S&P 500 stocks in the Real Estate sector to outperform every other sector in both of its tariff scenarios. Furthermore, we calculated foreign exposure of all 158 members of the MSCI US REIT Index (Bloomberg: RMZ), finding that the RMZ would perform even better than the S&P 500 REITs due its lower exposure to foreign revenues.
The Impact of a Trade War on US Real Estate
There are two primary ways that tariffs would impact the value of real estate properties.
First, tariffs could cause property owners to lose current or potential future revenue via tenant bankruptcies or reduced total demand for their properties. For this to happen, a landlord must have current or prospective future tenants with high exposure to goods that are on the US or foreign tariff lists and are clearly sourced from the relevant countries. The most impacted properties here would be factories that have moved abroad, communities and business parks that sprung up as a result of specific trade agreements, and agricultural-oriented properties that are specifically designed for foodstuffs now subject to tariffs.
In addition, a landlord must also have current or near-term vacancy risk, as only bankruptcy judges can void leases or force landlords to renegotiate them. Finally, even if a tenant has the ability to leave at the end of a lease, it must have an untapped efficiency/suitable substitute for their current RE footprint. For example, a gas station has to be within driving distance of its customers – it is irrelevant if they could lower their expenses by moving if it means they lose all of their sales.
Second, tariffs could increase the cost of new development or redevelopment for owners of real estate. Historically 30-60% of the total development costs of commercial and residential developments are attributable to land, labor, and professional services fees. The remaining 40-70% come from hard costs: steel, pre-fabricated concrete walls, framing lumber, heavy installed equipment, and mechanical, electrical, and plumbing (MEP) systems.
Based upon our analysis, suburban office, mall, healthcare, and apartment buildings are at the low end while CBD office, suburban industrial, self-storage facilities, resorts, single-family homes, cell towers and data centers are at the high end. For redevelopments, hard costs make up an even higher percentage of incremental project cost as the land is already owned.
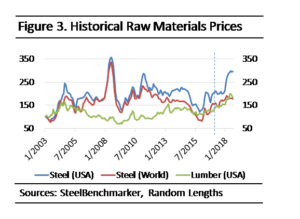
The best way to see how much tariffs have impacted hard costs is to look at the historical prices Americans have had to pay for raw materials. Figure 3 shows the historical prices for benchmark hot-rolled band steel for delivery to US and non-US customers, as well as framing lumber. All three lines are indexed to 100 based on a relatively normal point in the economic cycle, 1/1/2003. The dotted vertical line indicates November 8, 2016, when Donald Trump won the presidential election.

US REITs Actually Net Beneficiaries in a Trade War
Not only do we believe that US REITs would outperform the S&P 500 in a trade war but we also believe the vast majority of US REITs will actually be net beneficiaries should such a scenario occur. In addition, if trade tensions were to escalate to the point to where they pushed the US into a prolonged recession, US REITs would certainly trade down on lower economic growth, but we believe they would still outperform the S&P 500. US REITs are uniquely underexposed to the above-mentioned risks.
First, they have low exposure to properties whose current and prospective tenants are highly-tariff dependent. US REITs derive most of their revenue and value from properties in the US, as shown previously in Figure 2, which by definition are less dependent upon international trade flows. Tenant verticals that have the most tariff risk include manufacturers that rely upon inexpensive foreign labor and raw materials for much of their finished goods (industrial equipment, automobiles, apparel, hardware, telecom equipment) and agricultural regions being targeted by foreign tariffs on US foodstuffs. US REITs have very few assets in the agricultural heartland, and over 80% of manufacturing real estate exists outside the industrial REIT universe because it is mostly owned by its occupant. While retail REITs do have high tenant exposure to apparel and computer equipment sales, the companies’ above average locations should limit the impact of any tenant fallout.
Second, US REITs derive over 90% of their revenues and value from existing assets, as opposed to development projects or non-income producing land. Why does this matter? To the degree that tariffs increase construction costs, they actually benefit the owners of existing assets, as new competitive supply is either discouraged from coming to market or forced to do so at higher rents and from a higher basis than existing assets. We believe that REITs are already benefiting from this, and it would only help the supply/demand environment should the construction pipelines decline further.
The Best and Worst REITs in a Trade War
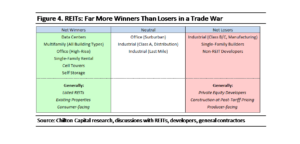
Making the aggressive assumption that no new American or foreign tariffs will be put in place after August 2018, we estimate that in-place tariffs have already increased the replacement cost of well-maintained existing properties by 2-4%. If we assume a more negative scenario where the full slate of proposed China, auto, and other tariffs are made effective, we would increase this number to 5-8%. In both scenarios, traditional office, retail, and multifamily assets are on the low end of these ranges and cell towers and data centers are on the high end (Figure 4).

While several of the largest cell tower and data center REITs have the highest international exposures of any REITs, we recommend that investors ignore short-term currency noise and focus on the long-term drivers of demand for tech REITs with network-dense portfolios that are less focused on new domestic development. The best examples of this are American Tower (NYSE: AMT) and CoreSite (NYSE: COR). These REITs will benefit the most from higher replacement costs, as tariffs will not slow down the shift to the cloud or growing demand for streaming mobile data. They will, however, significantly raise the value of their existing backup generators, steel towers, installed fiber/telecom equipment, and server racks.
An easier case can be made for multifamily residential and single-family rental REITs, who doubly benefit from higher replacement costs. Higher new construction costs put upward pressure on the value of their existing assets, but they also make their renters less likely to move out and buy their own homes.
Class A office REITs with relatively young portfolios in large gateway cities such as Boston Properties (NYSE: BXP), SL Green (NYSE: SLG), and Vornado Realty Trust (NYSE: VNO) should particularly benefit from steel tariffs. Skyscrapers in dense urban cores like Manhattan are some of the most steel-intensive projects on Earth. Thus far, the reconstruction of the World Trade Center has required over 110,000 tons of structural steel, and Related’s Hudson Yards mega-project is expected to approach 200,000 tons by the time it is finished in 2024. Both projects are also having to import the majority of their largest steel beams from Luxembourg, as no domestic steel mill can produce them.
The only REITs that we believe could have considerable net downside in a protectionist environment are a subset of manufacturing-oriented big box industrial REITs that focus on California seaports (China), El Paso and Laredo, Texas (Mexico), the Great Lakes region (Canada), or East Coast seaports (European Union). Exposure to trade-sensitive tenants in these markets is highest in STAG Industrial (NYSE: STAG), WP Carey (NYSE: WPC), Lexington Property Trust (NYSE: LXP), and Select Income Realty (NYSE: SIR). While some analysts would include Prologis (NYSE: PLD) and Rexford Industrial (NYSE: REXR) here, we do not as they are consumption-oriented, with REXR also protected by its focus on small-box, last-mile properties.
Most industrial REITs should see minimal long-term net impacts from tariffs, as benefits from higher industrial replacement costs (e.g. lower new supply) and the tailwind of e-commerce/last mile supply chain reconfigurations will likely overwhelm any trade-related vacancy. In addition to high-barrier PLD and REXR, we would include lower- barrier companies Duke Realty (NYSE: DRE), First Industrial (NYSE: FR), and Liberty Property Trust (NYSE: LPT) here, as they have suffered through cash-flow dilutive portfolio recycling programs for several years, exiting higher cap rate export-driven built-to-suits, low-barrier non-core MSAs and property types, and paying down debt. They saw the writing on the wall from offshoring and lean supply chain disruption in the 1990s and early 2000s, and they wanted to protect themselves against just the type of trade disruption we now face. As a result they today have less single tenant, industry, or export destination exposure than ever before.
It is too early and the trade negotiations have been too volatile for any investor to precisely forecast the long-term impact of a mild/moderate trade war on any sector, but we believe investors can be confident that US REITs should serve as a natural hedge against trade and currency risk.
Parker Rhea, prhea@chiltonreit.com, (713) 243-3211
Matthew R. Werner, CFA, mwerner@chiltonreit.com, (713) 243-3234
Bruce G. Garrison, CFA, bgarrison@chiltonreit.com, (713) 243-3233
Blane T. Cheatham, bcheatham@chiltonreit.com, (713) 243-3266
RMS: 1839 (3.31.2018) vs 2000 (12.31.2017) vs. 346 (3.6.2009) and 1330 (2.7.2007)
Previous editions of the Chilton Capital REIT Outlook are available at www.chiltonreit.com/reit-outlook.html.
An investment cannot be made directly in an index. The funds consist of securities which vary significantly from those in the benchmark indexes listed above and performance calculation methods may not be entirely comparable. Accordingly, comparing results shown to those of such indexes may be of limited use.
The information contained herein should be considered to be current only as of the date indicated, and we do not undertake any obligation to update the information contained herein in light of later circumstances or events. This publication may contain forward looking statements and projections that are based on the current beliefs and assumptions of Chilton Capital Management and on information currently available that we believe to be reasonable, however, such statements necessarily involve risks, uncertainties and assumptions, and prospective investors may not put undue reliance on any of these statements. This communication is provided for informational purposes only and does not constitute an offer or a solicitation to buy, hold, or sell an interest in any Chilton investment or any other security.
for more info on our strategy
go now →
for more info on our strategy
go now →
VIEW CHILTON'S LATEST
Media Features
go now →
Contact Us
READ THE LATEST
REIT Outlook
go now →
disclaimers
terms & conditions & FORM ADV
SITE CREDIT
Navigate
HOME
TEAM
REITS 101
Approach
OUTLOOKS
media
Contact
back to top
VISIT CHILTON CAPITAL MANAGEMENT
This property and any marketing on the property are provided by Chilton Capital Management, LLC and their affiliates (together, "Chilton"). Investment advisory services are provided by Chilton, an investment adviser registered with the SEC. Please be aware that registration with the SEC does not in any way constitute an endorsement by the SEC of an investment adviser’s skill or expertise. Further, registration does not imply or guarantee that a registered adviser has achieved a certain level of skill, competency, sophistication, expertise or training in providing advisory services to its advisory clients. Please consider your objectives before investing. A diversified portfolio does not ensure a profit or protect against a loss. Past performance does not guarantee future results. Investment outcomes, simulations, and projections are forward-looking statements and hypothetical in nature. Neither this website nor any of its contents shall constitute an offer, solicitation, or advice to buy or sell securities in any jurisdictions where Chilton is not registered. Any information provided prior to opening an advisory account is on the basis that it will not constitute investment advice and that we are not a fiduciary to any person by reason of providing such information. Any descriptions involving investment process, portfolio construction or characteristics, investment strategies, research methodology or analysis, statistical analysis, goals, risk management are preliminary, provided for illustration purposes only, and are not complete and will not apply in all situations. The content herein may be changed at any time in our discretion . Performance targets or objectives should not be relied upon as an indication of actual or projected future performance. Investment products and investments in securities are: NOT FDIC INSURED • NOT A DEPOSIT OR OTHER OBLIGATION OF,OR GUARANTEED BY A BANK • SUBJECT TO INVESTMENT RISKS, INCLUDING POSSIBLE LOSS OF THE PRINCIPAL AMOUNT INVESTED. Investing in securities involves risks, and there is always the potential of losing money when you invest in securities including possible loss of the principal amount invested. Before investing, consider your investment objectives and our fees and expenses. Our advisory services are designed to assist clients in achieving discrete financial goals. They are not intended to provide tax advice, nor financial planning with respect to every aspect of a client’s financial situation, and do not incorporate specific investments that clients hold elsewhere. Prospective and current clients should consult their own tax and legal advisers and financial planners. For more details, see links below to CRS (Part 3 of Form ADV) for natural person clients; Part 2A and 2B of Form ADV for all clients regarding important disclosures.