Data Center REITs On Sale Despite Record Leasing | February 2019
February 1, 2019
The data center REIT sector had a rough year in 2018. For the first time ever, its total return, -16.1% on an equal-weighted basis and -13.7% on a market cap weighted basis, was more than 650 basis points (or bps) behind the -4.5% and -7.1% total returns of the MSCI US REIT Index (Bloomberg: RMS G) and the S&P 500 (Bloomberg: SPX), respectively.1 What happened, and should long-term investors in the space be concerned?
In late 2018, we posed these questions to the publicly-traded data center companies and many large dedicated and non-real estate dedicated experts. There was a strong consensus that the worst performing data center REIT, QTS Realty Trust (NYSE: QTS), primarily sold off for company-specific reasons. QTS took a huge write-down on its cloud and managed services businesses in February, effectively guiding to a 15% roll-down in revenues as it became the last large public data center owner/operator to admit that it could not compete in the space with Amazon (NASDAQ: AMZN), Microsoft (NASDAQ: MSFT), Google (NASDAQ: GOOGL), and IBM (NYSE: IBM).
For the rest of the data center REITs, there was a general agreement that drivers of underperformance were (a) the global tech selloff in 3Q18 and 4Q18 and (b) decelerating per share earnings growth and guidance for ’18 and ’19.
While we were frustrated by both (a) and (b), our discussions revealed that many investors sold data centers in 2018 because they feared that (a) and (b) were connected. Specifically, they believed that the primary causes of the tech selloff – lofty valuation multiples, decelerating top-line growth, angst over Chinese GDP and trade, and growing regulatory risk – were reducing cloud service provider (CSP) and enterprise demand for data center space. This could not be further from the truth. In fact, our research indicates that demand for wholesale data center space hit an all-time high in 2018 and shows no signs of abating.
“For the five largest US markets –Northern Virginia, Northern California, DFW, Chicago, and Phoenix – datacenterHawk reported net absorption of 377 MWs in 2018. This is a new record, beating the previous record by 32% and 2017 absorption by 81%.”
As a result of the 2018 underperformance, data center REIT net asset value (NAV) discounts are near post-GFC highs, despite unprecedented private equity interest and investment in the space. Even if this wall of private capital does not shrink data center REIT discounts to NAV, we believe that high single-digit per share cash flow and dividend growth should translate into 10-15% average annualized total returns over the next few years.
Correlation Does Not Equal Causation
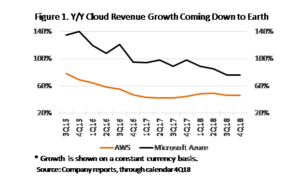
Large technology companies and CSPs (called hyperscalers) are easily the biggest tenants of data center REITs, so it is not surprising that they would tend to trade together over short periods of time. Data center absorption statistics are notoriously approximate, but most industry research firms believe that these companies have been responsible for close to half of all data center development and leasing over the past few years. Much of the tech selloff was fueled by concerns about the long-term deceleration in cloud segment revenue growth at some of the largest hyperscalers. Figure 1 illustrates this trend for the cloud platforms of AMZN and MSFT, AWS and Azure. These are the two largest CSPs in the world, with 49% share of the global cloud infrastructure services market in 3Q18, according to Synergy Research Group.


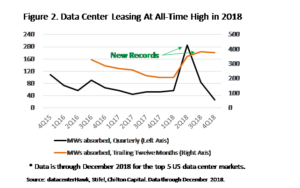
Given this slowdown, one would expect to see data center net absorption (leasing activity net of move-outs) to decelerate, as well, but it has actually done the opposite. Thus far, only one of the industry’s research firms, datacenterHawk, has published full year 2018 leasing numbers, but the results are stunning.
For the five largest US markets –Northern Virginia, Northern California, DFW, Chicago, and Phoenix – datacenterHawk reported net absorption of 377 MWs in 2018. This is a new record, beating the previous record by 32% and 2017 absorption by 81%. Figure 2 shows historical absorption in these markets, which make up about 70% of wholesale multi-tenant data center capacity in the US.


DatacenterHawk 4Q18 numbers update and confirm the 1Q18-3Q18 data that have been published by CBRE and JLL, which show that the top five markets, the top ten markets, Northern Virginia, London, Phoenix, and the combined FLAP markets (Frankfurt, London, Amsterdam, and Paris) all put up new quarterly and annual absorption records in 2018.
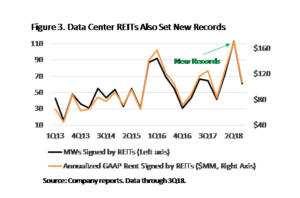
CyrusOne (NASDAQ: CONE), Digital Realty Trust (NYSE: DLR), and the combined data center REIT sector all set new quarterly leasing records in 2Q18. 2018 total leasing should easily set new records for MWs leased and annualized new leasing revenue, as data center REITs had already tied the previous annual record for MWs leased by the end of 3Q18 (Figure 3).


In 2Q18, developer CloudHQ signed the biggest data center lease ever with Facebook (NASDAQ: FB) for 72 MWs in Northern Virginia, more than doubling the previous 35 MW record set in 2016. According to North American Data Centers, there were six 20+ MW leases signed through in the first 11 months of 2018, as many as were signed over the previous five years combined!
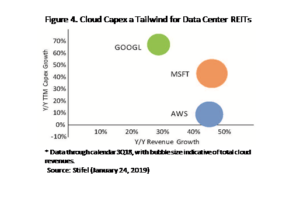
Growth also showed up on the cash flow statements of the hyperscalers, capital expenditures (capex) and capital lease acquisitions in 2018. Figure 4 plots Stifel’s best estimates of cloud capex growth against revenue growth for AWS, Azure, and GOOGL. Through 3Q18, both GOOGL and MSFT capex actually accelerated year-over-year, and AWS would have as well had it not already grown capex and lease expenses by 77% in 2017.

Cloud capex should not consistently grow faster than cloud revenue, but it can keep up with it for longer than most people think. Cybersecurity concerns, data sovereignty, private cloud adoption, and lower latency requirements, combined with long-term declines in the price of cloud storage, have led CSPs to become more redundant and distributed, requiring more data center spend per gigabyte of cloud storage. But they also lower margins for CSPs. As long as these trends continue, it is possible that data center capex can keep up with or exceed the growth rate of cloud services cloud revenue.

Data Center Investors: Their Own Worst Enemies
If demand for data centers is so strong, why has recent cash flow per share and same store revenue growth been so light? Our research and channel checking suggest two likely culprits: initially dilutive mergers and acquisitions (M&A)/portfolio recycling and increased supply.
High-priced M&A is another example of data center REITs being the victims of their own success, for it was their history of mid-teens unlevered development yields that caused private capital to flow into the space. Public and private investors now feel more comfortable paying mid-to-high single digit stabilized yields for mission-critical wholesale colocation assets leased to high-credit tenants on long-term leases, compared to the low teens returns they used to insist upon for such deals. This will remain a headwind to cash flow per share growth as long as data center REITs keep making large portfolio/company acquisitions. It will dissipate if they allocate more of their money to ground-up development, though development yields will likely trend lower as well.
Long-time investors in data centers are used to high levels of new supply, as this has been necessary to keep up with the incredible growth in demand for cloud and outsourced IT services. However, supply finally seemed to eclipse demand in several low-barrier markets in 2018. Supply especially weighed on occupancy and rental revenue growth in Las Vegas/Reno, Phoenix, Dallas-Fort Worth, Richmond/Central Virginia, and Atlanta. Much of this is due to five private or non-REIT developers: Switch (NASDAQ: SWCH), EdgeCore, STACK Infrastructure, PointOne, and CloudHQ. Together, these five companies have domestic development pipelines of approximately 1,500 MWs, 750 MWs, 450 MWs, 425 MWs, and 385 MWs, respectively. In contrast, supply is much lower in higher barrier wholesale markets such as San Francisco/Silicon Valley, and Los Angeles, as well as key global markets London, Frankfurt, Amsterdam, Paris, Hong Kong, Singapore, and Tokyo.
Finally, new supply is minimal in network-dense internet exchange point (IXP) retail colocation facilities. In our April 2018 REIT Outlook, we compared these facilities to international airports, whose competitive advantage and network effects make them as close to monopolies as we have found in the real estate business. Equinix (NASDAQ: EQIX) has long been the 800-pound gorilla in this business, but it has also increasingly become the most focused on it. In the last quarter of 2018, EQIX had an estimated 90% of its asset value coming from IXPs, down from ~95% at the end of 1Q16. CoreSite (NYSE: COR) and DLR, by contrast, derived an estimated 31% and 28% of their asset value from IXPs in 4Q16, down from 37% and 36% three years ago.
Going forward, we see the best risk-adjusted upside in (1) network-dense retail colocation/interconnection data centers and (2) low-cost high-growth international wholesale developers. Our two favorite stocks in these spaces are EQIX and CONE.
The recent selloff of tech and data center stocks has put all data centers on sale, and we believe all well-managed data center REITs should benefit from strong secular tailwinds over the next few years, even if valuation multiples do not return to historical averages. In such a scenario, these REITs should outperform, as our analysis indicates they will soon return to sector-leading cash flow and dividend per share growth.
1 Simple and market capitalization weighted averages include total returns from Equinix (NASDAQ: EQIX), Digital Realty Trust (NYSE: DLR), CyrusOne (NASDAQ: CONE), QTS Realty Trust (NYSE: QTS), and CoreSite (NYSE: COR).
Parker Rhea, prhea@chiltonreit.com, (713) 243-3211
Matthew R. Werner, CFA, mwerner@chiltonreit.com, (713) 243-3234
Bruce G. Garrison, CFA, bgarrison@chiltonreit.com, (713) 243-3233
RMS: 1909 (12.31.2018) vs 2000 (12.31.2017) vs. 346 (3.6.2009) and 1330 (2.7.2007)
Previous editions of the Chilton Capital REIT Outlook are available at www.chiltonreit.com/reit-outlook.html.
An investment cannot be made directly in an index. The funds consist of securities which vary significantly from those in the benchmark indexes listed above and performance calculation methods may not be entirely comparable. Accordingly, comparing results shown to those of such indexes may be of limited use.
The information contained herein should be considered to be current only as of the date indicated, and we do not undertake any obligation to update the information contained herein in light of later circumstances or events. This publication may contain forward looking statements and projections that are based on the current beliefs and assumptions of Chilton Capital Management and on information currently available that we believe to be reasonable, however, such statements necessarily involve risks, uncertainties and assumptions, and prospective investors may not put undue reliance on any of these statements. This communication is provided for informational purposes only and does not constitute an offer or a solicitation to buy, hold, or sell an interest in any Chilton investment or any other security.
for more info on our strategy
go now →
for more info on our strategy
go now →
VIEW CHILTON'S LATEST
Media Features
go now →
Contact Us
READ THE LATEST
REIT Outlook
go now →
disclaimers
terms & conditions & FORM ADV
SITE CREDIT
Navigate
HOME
TEAM
REITS 101
Approach
OUTLOOKS
media
Contact
back to top
VISIT CHILTON CAPITAL MANAGEMENT
This property and any marketing on the property are provided by Chilton Capital Management, LLC and their affiliates (together, "Chilton"). Investment advisory services are provided by Chilton, an investment adviser registered with the SEC. Please be aware that registration with the SEC does not in any way constitute an endorsement by the SEC of an investment adviser’s skill or expertise. Further, registration does not imply or guarantee that a registered adviser has achieved a certain level of skill, competency, sophistication, expertise or training in providing advisory services to its advisory clients. Please consider your objectives before investing. A diversified portfolio does not ensure a profit or protect against a loss. Past performance does not guarantee future results. Investment outcomes, simulations, and projections are forward-looking statements and hypothetical in nature. Neither this website nor any of its contents shall constitute an offer, solicitation, or advice to buy or sell securities in any jurisdictions where Chilton is not registered. Any information provided prior to opening an advisory account is on the basis that it will not constitute investment advice and that we are not a fiduciary to any person by reason of providing such information. Any descriptions involving investment process, portfolio construction or characteristics, investment strategies, research methodology or analysis, statistical analysis, goals, risk management are preliminary, provided for illustration purposes only, and are not complete and will not apply in all situations. The content herein may be changed at any time in our discretion . Performance targets or objectives should not be relied upon as an indication of actual or projected future performance. Investment products and investments in securities are: NOT FDIC INSURED • NOT A DEPOSIT OR OTHER OBLIGATION OF,OR GUARANTEED BY A BANK • SUBJECT TO INVESTMENT RISKS, INCLUDING POSSIBLE LOSS OF THE PRINCIPAL AMOUNT INVESTED. Investing in securities involves risks, and there is always the potential of losing money when you invest in securities including possible loss of the principal amount invested. Before investing, consider your investment objectives and our fees and expenses. Our advisory services are designed to assist clients in achieving discrete financial goals. They are not intended to provide tax advice, nor financial planning with respect to every aspect of a client’s financial situation, and do not incorporate specific investments that clients hold elsewhere. Prospective and current clients should consult their own tax and legal advisers and financial planners. For more details, see links below to CRS (Part 3 of Form ADV) for natural person clients; Part 2A and 2B of Form ADV for all clients regarding important disclosures.