More Families Choosing to Rent Single Family Residences | March 2019
March 1, 2019
Commercial real estate is one of the oldest industries in the world, thus making it one of the most mature. As it has developed, transparency has increased, making it harder to find opportunities for significant wealth creation.
The single family residential real estate industry is even older, and therefore one would think it presents even less opportunity for above average prosperity. One would also think that the single family residential industry is resistant to innovation given the long history of very little change. However, the 2008-2009 recession created an opportunity for innovation that has essentially institutionalized an industry that previously could not be.
Thanks to the collapse of housing prices in 2008-2009 at the same time that many owners were overleveraged (not a coincidence), American Homes 4 Rent (NYSE: AMH) founder Wayne Hughes and Blackstone (NYSE: BX) were in a “first mover” position to initially buy large portfolios of foreclosed homes at significant discounts to replacement value. Blackstone’s portfolio came public as Invitation Homes (NYSE: INVH) in 2017 and AMH went public in 2013. As home prices stabilized and the capital markets reopened, both REITs found themselves so far ‘in the money’ that they were able to take a risk in trying something that no one had previously been able to do: rent out and manage tens of thousands of homes. As of December 31, 2018, AMH owned 52,783 homes and INVH owned 80,807 homes dispersed in major cities across the United States.
We believe that the country is in the early stages of a secular shift toward renting single family homes due to affordability, cultural changes, tax reform, and low new supply. Ten years into the experiment, it is clear that single family rentals (or SFRs) have become a ‘new’ property type – something very rare for such a mature industry. INVH and AMH are positioned to take advantage of the secular trend and will only improve operating efficiency and tenant experience as time progresses.
Less Homeowners, More Renters
Anyone who has owned a home can relate to all the problems with managing thousands of houses with thousands of tenants: landscaping, utilities, maintenance capital expenditures (‘capex’), homeowners associations (or HOAs), and driving distance, to name a few. However, one of the reasons for the decline in the homeownership rate from a high of 68% in 4Q 2007 to 64% in 4Q 2017 is precisely due to these ‘annoying’ symptoms of homeownership. The cultural shift toward ‘Renter Nation’ is partly attributable to the change in sentiment against homeownership following the Great Recession but also due to a cultural shift among Millennials (those born between 1981 and 1996). This generation has grown accustomed to the high quality and highly amenitized nature of new apartments and college housing. Apartment renters nowadays are not as interested in owning a home with fewer amenities in a worse location while also having to spend time and money to maintain it.
Affordability has also acted as a headwind toward buying a home, which has driven tenants to rent for longer. Because the decision to marry and have children has been delayed, the average renter is getting older. According to a Harvard study in 2017, the average renter was 42 years old, which compared to 23 years old in 1985. Apartments have been a huge beneficiary of this, but single family rentals are benefiting as well – just a little later. Millennials do eventually get married, have children, and change their priorities. The professionally-managed single family home can solve the financial problem of having to come up with a large down payment. But, it also solves the issue of having to learn and pay for HVAC, plumbing, landscaping, etc. For example, INVH has a ‘ProCare Service’ which provides 24/7 service, an online resident portal, SmartHome technology (in 40% of its homes as of 12/31/18, and growing), proactive resident care visits, and property condition inspections. As a result, turnover at INVH declined from 35.5% in 4Q 2017 to less than 34.0% in only 9 months.
Driven to Rent
The 10 year average for new household formations is 1.05 million according to the census bureau. In comparison, the average annual new home starts for the past 10 years has only been 920,000. In 2018, over 2.2 million households were formed, but only 1.2 million homes were started – a gap of 1 million homes! The mismatch in supply and demand often creates a large increase in home prices, making homeownership less affordable and renting more attractive. In fact, INVH estimates the average rent in some of its markets is 30% less than the cost of owning a home!


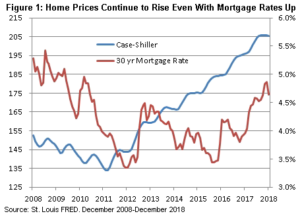
The homeownership rate has declined over the past 10 years despite a decline in mortgage rates. While the lower borrowing costs has helped affordability, it has been completely been offset by higher home prices. At 4.35% as of February 2019, the average 30 year fixed mortgage rate is about 124 bps below the 10 year high, which occurred in June 2011. However, the Case-Shiller US National Home Price Index is 36% higher than June 2011 as of December 31, 2018 (Figure 1). Now, with mortgage rates 94 basis points above the recent low reached in July 2016 and home prices only continuing to increase (up 12% since July 2016), the rent vs buy decision is tilting even further toward renting.
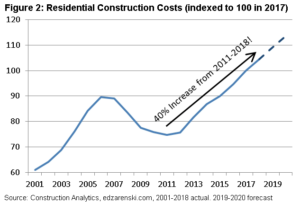
One of the reasons for the gap between home starts and household formation is the increase in construction and land costs. According to the Construction Analytics Index, the costs to build a new home have risen 40% since 2011, and are forecasted to increase another 9% by 2020 (Figure 2).
Furthermore, the recently enacted $10,000 limit on deductibility of State and Local Taxes (which includes property taxes) for federal income taxes has only made the rental option more appealing. As a result, while household formations should remain steady under current economic conditions, the supply of new homes is continuing to decline.


This has manifested into longer stays and better profit margins for the owners of single family rentals. The average stay has risen from 2.5 to 3.0 years as of December 31, 2018. This lowers the costs of vacancy and re-leasing (also called ‘turn costs’). But, it has another benefit in that the renters have the ability to increase their wages during that time, leading to a better credit profile and more opportunities for rent growth. The average household income in the INVH portfolio is now over $100,000! AMH cites similar statistics, which has allowed them to increase rent on renewals by 3% in 2017, and 4% by the end of 2018.
Opportunities at the Margin
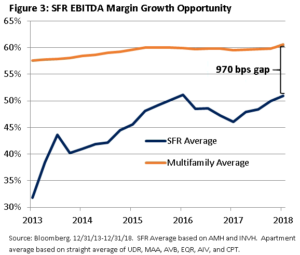
While rent and occupancy will grow thanks to the above mentioned fundamentals, in our opinion, the SFR REITs also have an opportunity to grow cash flow through ancillary income. They are already making hefty margins on the ‘SmartHome’ investments, where costs are $9 per month and they are able to charge $18 per month. They have other opportunities to capture profits from renter insurance, pest control, pet care, landscaping, security system, and moving services. Finally, single family rental margins are significantly lower than apartments. We believe they won’t ever be able to match the efficiency of having 250 identical units in a small footprint; however, they can make significant gains in efficiencies through technology and experience that can close the gap. SFRs actually have more opportunities for ancillary income than are available to apartment owners, which we believe will close the gap more than the market may be anticipating (Figure 3). We can relate this to the self storage business, where tenant insurance net income for ExtraSpace (NYSE: EXR) increased from $30 million in 2012 to $90 million in 2018 with little to no capital expenditures. As a result, we project same store net operating income growth of AMH and INVH will average +3.5% per year for the next five years, which compares to only +2.5% for apartment REITs.


Chilton SFR Allocation
In 2018, AMH and INVH produced total returns of -8.4% and -12.9%, respectively, which compared to the MSCI US REIT Index at -4.6%. 2018 performance was impacted by unexpected expense growth through high employee turnover, new maintenance system implementations, property tax increases, merger integration issues (specific to INVH), and weather (most notably hurricanes). Through February 25, 2019, AMH and INVH have produced year to date total returns of +10.0% and +15.2%, respectively, which compare to the RMS G at +12.5%. As of the same date, they were trading at 21.4x and 20.9x 2019 adjusted funds from operations (or AFFO), respectively, which compare to the REIT average of 18.5x. While we believe expense growth will be higher and somewhat less predictable than other sectors, the revenue growth story through mismatched supply/demand and potential stabilization of expenses around inflation should lead to above average margin growth for the following years. As a result, the Chilton REIT Composite has a 5.7% allocation to AMH and INVH combined as of February 26, 2019, which compares to the MSCI US REIT Index at 3.7%.
Parker Rhea, prhea@chiltonreit.com, (713) 243-3211
Matthew R. Werner, CFA, mwerner@chiltonreit.com, (713) 243-3234
Bruce G. Garrison, CFA, bgarrison@chiltonreit.com, (713) 243-3233
RMS: 1909 (12.31.2018) vs 2000 (12.31.2017) vs. 346 (3.6.2009) and 1330 (2.7.2007)
Previous editions of the Chilton Capital REIT Outlook are available at www.chiltonreit.com/reit-outlook.html.
An investment cannot be made directly in an index. The funds consist of securities which vary significantly from those in the benchmark indexes listed above and performance calculation methods may not be entirely comparable. Accordingly, comparing results shown to those of such indexes may be of limited use.
The information contained herein should be considered to be current only as of the date indicated, and we do not undertake any obligation to update the information contained herein in light of later circumstances or events. This publication may contain forward looking statements and projections that are based on the current beliefs and assumptions of Chilton Capital Management and on information currently available that we believe to be reasonable, however, such statements necessarily involve risks, uncertainties and assumptions, and prospective investors may not put undue reliance on any of these statements. This communication is provided for informational purposes only and does not constitute an offer or a solicitation to buy, hold, or sell an interest in any Chilton investment or any other security.
for more info on our strategy
go now →
for more info on our strategy
go now →
VIEW CHILTON'S LATEST
Media Features
go now →
Contact Us
READ THE LATEST
REIT Outlook
go now →
disclaimers
terms & conditions & FORM ADV
SITE CREDIT
Navigate
HOME
TEAM
REITS 101
Approach
OUTLOOKS
media
Contact
back to top
VISIT CHILTON CAPITAL MANAGEMENT
This property and any marketing on the property are provided by Chilton Capital Management, LLC and their affiliates (together, "Chilton"). Investment advisory services are provided by Chilton, an investment adviser registered with the SEC. Please be aware that registration with the SEC does not in any way constitute an endorsement by the SEC of an investment adviser’s skill or expertise. Further, registration does not imply or guarantee that a registered adviser has achieved a certain level of skill, competency, sophistication, expertise or training in providing advisory services to its advisory clients. Please consider your objectives before investing. A diversified portfolio does not ensure a profit or protect against a loss. Past performance does not guarantee future results. Investment outcomes, simulations, and projections are forward-looking statements and hypothetical in nature. Neither this website nor any of its contents shall constitute an offer, solicitation, or advice to buy or sell securities in any jurisdictions where Chilton is not registered. Any information provided prior to opening an advisory account is on the basis that it will not constitute investment advice and that we are not a fiduciary to any person by reason of providing such information. Any descriptions involving investment process, portfolio construction or characteristics, investment strategies, research methodology or analysis, statistical analysis, goals, risk management are preliminary, provided for illustration purposes only, and are not complete and will not apply in all situations. The content herein may be changed at any time in our discretion . Performance targets or objectives should not be relied upon as an indication of actual or projected future performance. Investment products and investments in securities are: NOT FDIC INSURED • NOT A DEPOSIT OR OTHER OBLIGATION OF,OR GUARANTEED BY A BANK • SUBJECT TO INVESTMENT RISKS, INCLUDING POSSIBLE LOSS OF THE PRINCIPAL AMOUNT INVESTED. Investing in securities involves risks, and there is always the potential of losing money when you invest in securities including possible loss of the principal amount invested. Before investing, consider your investment objectives and our fees and expenses. Our advisory services are designed to assist clients in achieving discrete financial goals. They are not intended to provide tax advice, nor financial planning with respect to every aspect of a client’s financial situation, and do not incorporate specific investments that clients hold elsewhere. Prospective and current clients should consult their own tax and legal advisers and financial planners. For more details, see links below to CRS (Part 3 of Form ADV) for natural person clients; Part 2A and 2B of Form ADV for all clients regarding important disclosures.