The Chilton Global Real Estate Strategy | October 2019
October 1, 2019
Since we began publishing the Chilton REIT Outlook, we have consistently been proponents of a US-focused, actively managed strategy. However, international REIT markets across both developed and emerging countries have made significant advancements in the ‘investability’ of their own publicly traded real estate securities as of late. We now believe such markets have matured and grown to a point where a diversified portfolio provides an attractive risk-adjusted return, especially when combined with a US REIT portfolio. Impressively, the international portion of the FTSE EPRA/NAREIT Global Index Net TR (Bloomberg: TRNHGU) was about equal to the US allocation.
On February 1, 2019, we launched the Chilton Global Real Estate Strategy to take advantage of the global opportunity. While we have not lost confidence in the long term positive view of the US market, we believe that the Chilton Global Real Estate Strategy is an appropriate investment solution for investors looking to increase diversification and gain exposure to the international markets given their more recent advancements.
The Origin of the Chilton Global Real Estate Strategy
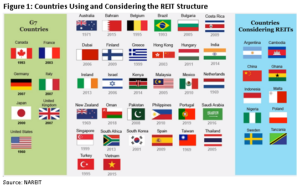
We have used a concentrated US portfolio to outperform the index since the US REIT strategy’s inception in 2005. However, we believe that a passive, diversified international real estate portfolio can be additive for investors looking to increase diversification. As shown in Figure 1, 38 international countries have passed legislation for the REIT structure and eight more are considering it as of this publication. Other countries that do not yet have the REIT structure have also used the public markets for high quality commercial real estate owners and developers, which can provide further diversification.

The Chilton Global Real Estate Strategy employs a mix between the US Chilton REIT Strategy and an international real estate ETF to provide the diversification needed to decrease portfolio risk. We use proprietary research to determine the appropriate international exposure given the projected two year forward returns in the US as compared to international real estate markets, guided by several risk limits.
We believe that the strategy can produce risk-adjusted returns above the FTSE EPRA/NAREIT Global Index Net TR (Bloomberg: TRNHGU) through both the alpha generated from the US actively managed component and the proprietary tactical weight allocation changes made between the US and passive international exposure.
The Global Opportunity
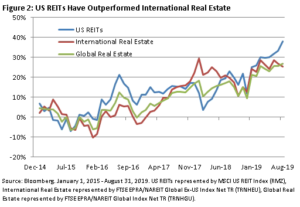
In our January 2015 REIT Outlook titled “US is the Best, or at Least Better Than the Rest,” we gave an overview of several of the largest international markets (Japan, Australia, Europe) as compared to the US, concluding that the US should produce superior returns due to higher GDP growth, an appreciating dollar, and lower geopolitical risk. As shown in Figure 2, this theory proved mostly correct: the MSCI US REIT Index (Bloomberg: RMZ) outperformed the FTSE EPRA/NAREIT Global Ex-US Index Net TR (Bloomberg: TRNHEU) by over 1200 bps (+38% versus +25%) from January 2015 to August 2019. In comparison, TRNHGU, which is comprised of real estate securities from across the globe, produced a total cumulative return (net of dividend withholding taxes from a US-domiciled investor) of only +27%, lagging the RMZ by over 1100 bps.

While we were correct about the superior performance opportunity, we addressed ‘risk’ in somewhat of a non-traditional manner. Essentially, we contended that an exposure to a new international market increased risk due to the additional currency, geopolitical, and economic risk. However, ‘risk’ in the traditional sense has come to be defined by ‘volatility’, where standard deviation serves as the unit of measurement.
Thus, while the US market had the highest return, it also displayed the highest volatility with a 14.1% annualized standard deviation. In comparison, the international real estate index had an annualized standard deviation of 12.6%, and the global index exhibited only an 11.6% annualized standard deviation over the same period, as shown in Figure 3. Interestingly, the international real estate markets, when combined together, produced lower volatility than the US market. Furthermore, the combination of international with US brought down volatility even further!

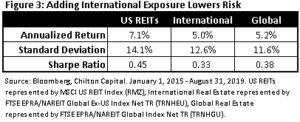
This phenomenon is an example of ‘Modern Portfolio Theory’ (or MPT), which was introduced by Harry Markowitz in 1952, eventually bringing him a Nobel Prize in Economics. According to MPT, overall risk of a portfolio can be decreased by adding more risky assets as long as they have a correlation of less than one. Thus, while the international real estate index had higher individual currency, geopolitical, and economic risks, the combination of all of them together actually produced a less volatile return stream. And, logically, the combination of the US with the international produced an even lower standard deviation. While the Sharpe Ratio, a measurement of ‘risk-adjusted return’, remained highest in the US, the global index was not far behind.
US Still the Best, but For How Long?
As we stated in the September 2019 REIT Outlook, we are bullish on the near term US REIT fundamentals and future returns. The combination of a lower 10 yr Treasury yield (though still not as low as Japan or Europe) and positive GDP/employment growth should drive total returns higher for the balance of the year, and likely into 2020. However, the US real estate cycle is now 10 years old and will not last forever. While we don’t believe the US will enter a recession in 2020, it will happen eventually.
Meanwhile, GDP growth in the Eurozone has dwindled to 1.2% in 2Q 2019 (down from 1.3% in 1Q 2019), and Japan is similarly stuck at 1.0% (in both 1Q and 2Q 2019). The low inflation and employment growth may trigger some localized recessions (i.e. Germany). The above economic conditions are the main drivers behind the ‘easing’ monetary policy for both the European Central Bank and the Japan Finance Minister. While the US has recently cut short term interest rates, the tariffs are more than offsetting any Fed attempts to steepen the interest rate curve. Similarly, the US easing is far behind the rest of the world. While the US 10 yr Treasury yield seems low at 1.7% as of September 26, the German 10 yr Bund yields -0.6% and the Japanese 10 yr Government bond yields -0.3%. Thus, the US Dollar should continue to appreciate against other currencies, which may diminish returns for US investors in international markets.

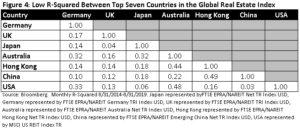
Notably, the US is not ‘in sync’ with the rest of the world, and the rest of the world will not trade in tandem either, as shown in Figure 4. No country in the top seven largest allocations from the FTSE EPRA/NAREIT Global Index exhibited an R-Squared above 0.44 with another for the five years ending August 31, 2019. Statistically, an R-squared above 0.50 would indicate a positive relationship.
The global real estate strategy offers the ability to own companies in countries that are emerging from a recession when the US goes into a recession. Our proprietary research should be able to capitalize on this opportunity. In the meantime, there will be arbitrage opportunities between the international and US market based on valuation and implied future returns that can drive short term outperformance as well.
The balancing act between the US and international markets within the Chilton Global Real Estate Strategy should command a long term strategic allocation from investors looking to lower portfolio risk through diversification. In contrast to a US REIT allocation that can only protect the downside through cash and defensive companies in a downturn, the Global Real Estate Strategy can increase the allocation to international markets that may experience positive returns. Additionally, the diversified nature of the strategy also should assuage any investors who try to ‘time’ the market as we understand it can be difficult to add to a market when it is at an all-time high, as the US market is as of September 26.
A Global Modern REIT Era
While the REIT structure was signed into US law in 1960, it took until the early 1990’s for it to take off with real estate owners and investors alike. Public REITs went from owning a small percentage of mostly lower quality real estate to now owning 20% of the highest quality commercial real estate in the country. Investors received an annualized total return of +11.1% from January 1992-August 2019 as measured by the FTSE NAREIT All Equity REITs Index (Bloomberg: FNER), which compares to the S&P 500 at +9.5%. Given the maturity of the market, we project stabilized long term total returns to be slightly lower than in the past, partly due to the lower risk profile, but also due to growth of REIT acceptance that provided price/earning multiple expansion along the way.
Though investors can’t go back in time to put all of their eggs into the US REIT basket, the Chilton Global Real Estate Strategy presents an opportunity to invest in other countries’ emergence and subsequent appreciation of securitized real estate. While US REITs have had the benefit of almost 60 years to ‘institutionalize’, the new REIT markets have yet to adopt many of the initiatives that have made US REITs so successful. Namely, low dividend payout ratios, low leverage, high transparency, a property type or geographic focus, shareholder friendly corporate governance, capital allocation prowess, conservative accounting, and a ‘right-sized’ development pipeline, among other things.

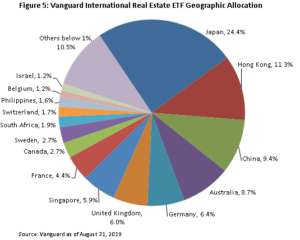
Currently, the Chilton Global Real Estate Strategy uses the Vanguard International Real Estate ETF (Bloomberg: VNQI), which boasts 615 different constituents spread over 37 countries. VNQI includes exposure to emerging markets (approximately 20% weight), many of which have yet to experience their own ‘modern REIT era’. See Figure 5 for the geographic diversification as of August 31, 2019. In addition to the broad geographic exposure, VNQI provides ample liquidity for our strategy with a market capitalization over $6 billion and competitive pricing with an annual fee of 12 basis points.
Developments in Developed Markets
In the past several years, several Japanese REITs have made simple corporate governance and capital allocation changes. In particular, the first ever stock buyback programs were announced by three Japanese real estate companies, all of which were founded at least 78 years ago: Mitsubishi Estate (TSE: 8802), Mitsui Fudosan (TSE: 8801), and Tokyo Tatemono (TSE: 8804). We believe this is a step in the right direction for companies looking to attract more institutional investors and garner a higher price/earnings multiple. For example, Mitsubishi Estate’s stock price increased by 9% on the day of the buyback announcement.
There have also been concerted efforts to lower the debt load at real estate companies across the globe. The average debt to enterprise value ratio of real estate companies in Japan and Europe (including the UK) as of September 20 was 39% and 43%, respectively, which seem high relative to the US at 27%. However, on September 21, 2018, Japan had a 43% ratio, and Europe (incl. UK) had a 44% ratio, which shows both have recognized that a lower leverage profile is ideal for long term predictability.
Yield
The thirst for yield is not unique to US investors. In fact, as we mentioned earlier, long term interest rates are lower in most other developed economies, which should drive capital flows to yield-oriented investments. While the yield of the VNQI was similar to the RMZ as of September 25 at 3.9%, the spread to the ‘risk free rate’, as measured by the 10 yr government bond was much greater in other counties. For example, the dividend yields in Japan and Germany as of September 20 were 3.1% and 4.0%, respectively, which compare to their 10 yr government bond yields below 0%.
Furthermore, the US REIT dividend carries significant tax advantages provided by the Tax Cut and Jobs Act of 2017. The bill reduced the maximum tax rate that an individual will pay on the ‘ordinary income’ portion of REIT dividends. Specifically, the bill treats REIT ordinary income from dividends as ‘pass through income’, which is subject to a 20% reduction in the tax rate. When combined with the top bracket tax rate of 37%, the new maximum tax rate on REIT dividends is 29.6% ((1‐20%)*37%). Historically, approximately 70% of REIT dividends have been classified as ordinary income. The other 30% is also tax-advantaged, classified as long term capital gains (20% rate) and return of capital (0% rate). As of August 31, 2019, the blended dividend yield on the Chilton Global Real Estate Strategy was 3.3%.

So Far, So Good
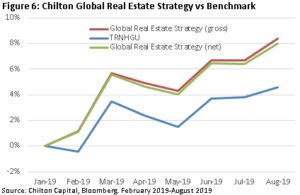
The results of the strategy thus far have been impressive, as shown in Figure 6. Though the operating history of the strategy is short, we are encouraged by the outperformance versus the benchmark in 2019. Prior to launch, we simulated a blend of the Chilton REIT Strategy with VNQI using the proprietary formula, and were encouraged by the ‘backtested’ results. We believe the strategy will continue to produce returns above the global benchmark using the blend of active and passive, while also providing diversification and lowering risk.
Matthew R. Werner, CFA
mwerner@chiltonreit.com
(713) 243-3234
Bruce G. Garrison, CFA
bgarrison@chiltonreit.com
(713) 243-3233
Richard J. Pickert, CFA
rpickert@chiltonreit.com
(713) 243-3211
RMS: 2421 (9.30.2019) vs 1909 (12.31.2018) vs 346 (3.6.2009) and 1330 (2.7.2007)
Previous editions of the Chilton Capital REIT Outlook are available at www.chiltonreit.com/category/library/reit-outlook/.
An investment cannot be made directly in an index. The funds consist of securities which vary significantly from those in the benchmark indexes listed above and performance calculation methods may not be entirely comparable. Accordingly, comparing results shown to those of such indexes may be of limited use.
The information contained herein should be considered to be current only as of the date indicated, and we do not undertake any obligation to update the information contained herein in light of later circumstances or events. This publication may contain forward looking statements and projections that are based on the current beliefs and assumptions of Chilton Capital Management and on information currently available that we believe to be reasonable, however, such statements necessarily involve risks, uncertainties and assumptions, and prospective investors may not put undue reliance on any of these statements. This communication is provided for informational purposes only and does not constitute an offer or a solicitation to buy, hold, or sell an interest in any Chilton investment or any other security.
for more info on our strategy
go now →
for more info on our strategy
go now →
VIEW CHILTON'S LATEST
Media Features
go now →
Contact Us
READ THE LATEST
REIT Outlook
go now →
disclaimers
terms & conditions & FORM ADV
SITE CREDIT
Navigate
HOME
TEAM
REITS 101
Approach
OUTLOOKS
media
Contact
back to top
VISIT CHILTON CAPITAL MANAGEMENT
This property and any marketing on the property are provided by Chilton Capital Management, LLC and their affiliates (together, "Chilton"). Investment advisory services are provided by Chilton, an investment adviser registered with the SEC. Please be aware that registration with the SEC does not in any way constitute an endorsement by the SEC of an investment adviser’s skill or expertise. Further, registration does not imply or guarantee that a registered adviser has achieved a certain level of skill, competency, sophistication, expertise or training in providing advisory services to its advisory clients. Please consider your objectives before investing. A diversified portfolio does not ensure a profit or protect against a loss. Past performance does not guarantee future results. Investment outcomes, simulations, and projections are forward-looking statements and hypothetical in nature. Neither this website nor any of its contents shall constitute an offer, solicitation, or advice to buy or sell securities in any jurisdictions where Chilton is not registered. Any information provided prior to opening an advisory account is on the basis that it will not constitute investment advice and that we are not a fiduciary to any person by reason of providing such information. Any descriptions involving investment process, portfolio construction or characteristics, investment strategies, research methodology or analysis, statistical analysis, goals, risk management are preliminary, provided for illustration purposes only, and are not complete and will not apply in all situations. The content herein may be changed at any time in our discretion . Performance targets or objectives should not be relied upon as an indication of actual or projected future performance. Investment products and investments in securities are: NOT FDIC INSURED • NOT A DEPOSIT OR OTHER OBLIGATION OF,OR GUARANTEED BY A BANK • SUBJECT TO INVESTMENT RISKS, INCLUDING POSSIBLE LOSS OF THE PRINCIPAL AMOUNT INVESTED. Investing in securities involves risks, and there is always the potential of losing money when you invest in securities including possible loss of the principal amount invested. Before investing, consider your investment objectives and our fees and expenses. Our advisory services are designed to assist clients in achieving discrete financial goals. They are not intended to provide tax advice, nor financial planning with respect to every aspect of a client’s financial situation, and do not incorporate specific investments that clients hold elsewhere. Prospective and current clients should consult their own tax and legal advisers and financial planners. For more details, see links below to CRS (Part 3 of Form ADV) for natural person clients; Part 2A and 2B of Form ADV for all clients regarding important disclosures.