Welcome to the New Cycle | September 2020
September 1, 2020
Commercial real estate has historically (and accurately) been described as ‘cyclical’, meaning there is a ‘reset’ at the end of every growth period. The reset has often come in the form of a ‘crash’, where the bottom falls out of pricing, and gains from the prior years are wiped out. As devastating as a crash is for landlords, this has proven to be the best time to invest (and the worst time to sell). However, because capital is normally not readily available during times of distress, most private landlords are not able to take advantage of the dislocation; furthermore, if leverage is too high, private owners can be forced to sell. In addition to limited capital availability, distressed times are characterized by wide bid-ask spreads and volatile prices, which makes agreeing on a price for a long term asset that much more difficult.
However, the public investor can take advantage of distress during a cycle reset. Anyone with a brokerage account can buy public REITs trading on the NYSE and NASDAQ at anytime of his or her choosing. Large asset managers with mandates to invest in real estate often pivot to invest in public REITs inside their private equity funds. Such was the case in 2009, and it has been repeated in 2020 due to the liquid nature and discounted prices that simply weren’t available in the private market. For example, Blackstone Group (NYSE: BX) bought over $1.1 billion in public REITs during the first quarter of 2020 despite being a private equity vehicle, as did Starwood Capital Group and Oaktree Capital Management. Due to COVID, direct investing into real estate essentially ground to a halt toward the end of the first quarter since normal due diligence was not possible due to the widespread lock down restrictions and related health concerns. Even today, the transaction market remains subdued.
Investors that bought in late March have been rewarded handsomely. From the low on March 23 through August 31, the MSCI US REIT Index (Bloomberg: RMZ) has produced a total return of +43.5%. However, the index is still 21.4% away from its February 21 high. This compares to the S&P 500, which is 3.4% above its February 19 high and hit an all time high on August 28, 2020. The relative discount at which REITs are trading to traditional equities reflects concerns about the timing of the resumption of job growth and secular changes due to COVID that could potentially have long term effects on several property types. While these are legitimate concerns, history has proven that the best times to invest have been during periods of great uncertainty and discounted valuations. We believe that the expected decline in new construction coupled with both record low interest rates and a resumption in job growth will favor commercial real estate and ignite a new real estate cycle.
Thus, the current conditions enable investors to take advantage of the early cycle period where we believe too much focus has been placed on risks and not the potential rewards that arise from buying at discounted valuations, especially relative to the positive fundamentals that could continue for many years after bottoming in the next 12-18 months. Though the period until reaching the bottom of fundamentals will be characterized by share price volatility, we are confident in the current long term buying opportunity due to our historical analysis. Furthermore, the volatility and slow, yet sustained, economic recovery from the current recessionary environment could create a fertile environment for active managers to take advantage of the widening gap between winners and losers.


Get in on the Ground Floor
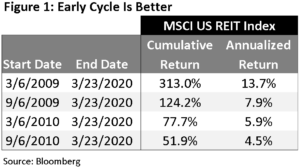
The gravestone of the previous real estate cycle will read “RIP Longest Real Estate Cycle in History: March 6, 2009 – March 21, 2020; +13.7% Annualized Total Return”. While investing at the bottom of the cycle would’ve been ideal, investors that joined 6, 12, or 18 months later enjoyed solid returns as well, especially adjusted for the lower risk given the economic recovery was evident. However, the numbers shown in Figure 1 prove that early investors experienced the highest total returns.

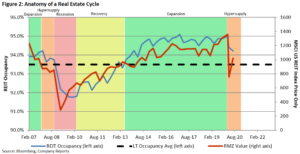
It is nearly impossible to pick the bottom of the market in real time, but we do know that prices begin their recovery before fundamentals find the bottom. Because real estate construction can vary from six months (industrial) to two or three years (urban office), real estate tends to lag the economy by one to two years. However, as mentioned above, public REIT prices tend to move well ahead of fundamentals. For example, the bottom for REIT prices in the previous cycle was March 6, 2009, but the bottom for REIT occupancy was 1Q 2010, shown in Figure 2. The investor who waited until the bottom of REIT fundamentals would have generated a total return of only +75.0% (+5.8% annualized) for the duration of the cycle ending March 23, 2020, thus losing out on 790 basis points (or bps) of annualized total return. Therefore, investors should not wait until fundamentals bottom to begin investing in REITs.

Despite the positive job growth and lack of construction, same store net operating income (or SSNOI) did not turn positive until 3Q 2010. Extrapolating the same timeline from the previous crash and recovery, we believe the bottom of real estate fundamentals will be in late 2021, setting the stage for a period of above average SSNOI growth from mid-2022 until the cycle matures, which has historically been five to ten years. In the previous cycle, the initial imbalance of supply and demand led to 33 straight quarters of above average REIT SSNOI growth. From 2Q 2011 to 2Q 2019, REIT SSNOI growth averaged +3.8%, well above the long term average of +2.8%.
As shown in Figure 2, the occupancy gains occur in Phases I and II, also called the Recovery and Expansion stages (highlighted in yellow and green). The same lag effect that creates the supply and demand imbalance in the Recovery and Expansion stages serves to exacerbate the occupancy declines in
Phases III and IV, also called the Hypersupply and Recession phases (highlighted in orange and pink). However, in these cases, supply exceeds demand, creating a period of declining rents and occupancy. The resulting ‘crash’ is what signals the end of the previous cycle and the beginning of a new cycle. We feel confident that we found the bottom of REIT prices in March for the new cycle, and thus will enter the recession phase in the next quarter or two. Using history as a guide, occupancy should bottom in late 2021 or early 2022, sparking the beginning of the recovery phase.
Valuation
One of the biggest differences between the previous crash in 2008-2009 and the 2020 crash is the 10 year Treasury yield. While the 10 yr Treasury yield bottomed out at 2.1% in December 2009, the yield as of August 31, 2020 was 0.7%, a full 140 bps lower. This should help REITs due to positive refinancing spreads and lower capitalization rates (higher prices), even as net operating income recovers and surpasses 2019 levels.
We use the spread between capitalization rates (or ‘cap rates) versus the 10 yr Treasury yield to measure the risk that the market is ascribing to current net operating income (which is the numerator in the implied cap rate equation). Historically, the average spread between cap rates and the 10 yr Treasury yield has been 360 bps; as of August 31, 2020, the spread was 540 bps. When looking only one quarter following the bottom of the market in 2009, the highest spread prior to 2020 was 500 bps. If the spread were to compress to the historical average while the 10 yr Treasury yield remains at 0.7%, REIT prices would increase by 41%!
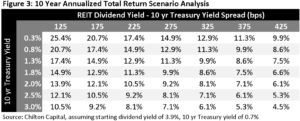
Given the uncertainty of current cash flows for some property types such as retail and office, we believe that dividend yield is a better measure of the market’s assumption of risk. The spread between the REIT dividend yield and the 10 yr Treasury yield has averaged 130 bps; as of August 31, the spread was 321 bps. The actual dividends paid by all REITs are set to increase as well, given that many lodging and retail REITs have temporarily cut or eliminated dividends to save cash and to offset the reduction in collected rent caused by so many mandated closures. If the spread were to compress to the historical average and the 10 yr Treasury yield remained constant, REIT prices would have to increase by 95%! As shown in Figure 3, the low 10 yr Treasury yield makes even the draconian scenario of a 425 bps spread attractive if it remains where it is today!


The ability to pay dividends is determined by cash flow after maintenance capital expenditures, or AFFO (Adjusted Funds from Operations). We believe the market is currently not fully appreciating the massive refinancing opportunity for REITs. For example, First Industrial (NYSE: FR) issued 10 year paper at 2.8%, which compares to its current average interest rate of debt at 4.0%. For all REITs, which boast a current weighted average interest rate of 3.4% and the ability to issue at 2.1%, we believe that refinancing could add 150 bps to annual AFFO growth for the next 3-5 years, even assuming constant leverage.
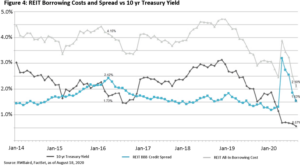
REIT borrowing costs reached an all-time low in August at 2.1% according to RWBaird and Factset. The spread of 153 bps versus the 10 yr Treasury yield compares to the average during 2019 and the prior low of 130 bps, indicating the REIT fixed income investors believe that the risk of investing in REITs is back to where it was just one year ago, as shown in Figure 4. In comparison, the MSCI US REIT Index is still 21.4% away from its all-time high back in February.


Last, REITs are attractive relative to the S&P 500. The forward P/E ratio of the S&P 500 has averaged 1.9 turns above the forward REIT AFFO multiple, according to Citi Research and FactSet. As of August 21, the S&P 500’s P/E ratio was 3.9 turns above the REIT AFFO multiple. Therefore, the REIT multiple would have to rise 2.0 turns to return to the historical average, which would result in an 11.1% increase to REIT prices.
Active Managers’ Time to Shine
One of our investing themes, other than ‘essentialness’, is that there will be a growing difference in valuation between the REIT ‘Haves’ and ‘Have-Nots’. With over 17 property types in the REIT sector today, and a multitude of stocks under each property type with different locations, management teams, and balance sheets, the divergence in performance is approaching all-time highs. In looking at the difference between the top and bottom quartile performers on a calendar year basis, 2020 is on pace to break the record of 11,000 bps set in 2009. Even so, with a historical average delta of 4,800 bps, there is ample opportunity for active REIT managers to produce performance above and beyond the benchmark even as the markets stabilize over the next few years.
With the large difference between top and bottom performers, we can generate alpha above the benchmark merely by avoiding the bottom performers. In looking at the performance of the Chilton REIT strategy for the past five full calendar years (2015-2019), the portfolio had an average underweight of 250 bps to the bottom quartile performers, and was only overweight such names in 2018. The strategy also added value by overweighting the top performers, averaging a 450 bps overweight for the same period.
According to our analysis, active REIT managers are able to beat their benchmarks at a much better rate than the average active domestic equity manager. We analyzed the performance of 61 REIT mutual funds in 2020 through August 10, and found that the median fund outperformed its benchmark, net of fees, by 416 bps, with 81% producing performance above the benchmark. Notably, the Chilton REIT Strategy produced a total return of -4.5%, net of all fees and expenses, which compared to the benchmark total return of -13.9%, resulting in 940 bps of outperformance. This compares to active domestic equity funds, where only 48% of managers outperformed their benchmark year to date through June 30 according to Morningstar. We believe our access to management, knowledge of properties, and ability to project cash flows lends itself to a much higher potential for outperformance than in other sectors.
Due to the confidence in our process, we have maintained a high ‘active share’ to the benchmark, averaging over 60% since inception in 2005. Active share is an indicator of how different one portfolio is from another portfolio, or benchmark index. As of August 31, the active share of the Chilton REIT Strategy versus the MSCI US REIT Index was 65%. We believe our differentiated and contrarian portfolio will continue to produce outsized alpha into the future.
The Investment for the Next 10 Years
Investors can participate in the growth of the US economy through an actively managed public REIT portfolio by adding a 5-15% allocation. The relative valuation versus both stocks and bonds is attractive, and the yields available on REITs today do not yet reflect the next 10 years of growth from organic and external (development/acquisitions) sources.
We understand that investors have more options than ever to consider for their portfolio today. Blackstone, Starwood, and other private equity firms will be able to be aggressive when the transaction market defrosts given their war chests of cash. However, the time it takes to source a deal to finally closing will result in a lengthy investment period. As a result, they will have to pay higher prices than REIT investors who were able to be fully invested this year, or will increase the risk profile by investing in out of favor property types. Adding in the high leverage and illiquid nature of private real estate, we believe public REITs will produce better risk-adjusted returns for investors in the coming cycle. In contrast, public REITs present an opportunity that is unique for professional active managers given the liquidity, transparency, and predictability. Furthermore, for yield-oriented investors, there are few alternatives available that can match the high current yield and future growth in dividends.
The risk in our short term outlook remains the timing of the economic recovery, including employment, consumer spending, and wages, all of which will depend on the timing, distribution, and effectiveness of a vaccine for COVID. Longer term, we are also looking at the heavy debt load incurred by the US to combat COVID with massive liquidity that could ultimately result in higher inflation rates. Fortunately, commercial real estate has historically been a beneficiary of higher replacement costs, and today’s public equity REITs are well-equipped to handle it successfully if such a condition materializes.
Matthew R. Werner, CFA
mwerner@chiltonreit.com
(713) 243-3234
Bruce G. Garrison, CFA
bgarrison@chiltonreit.com
(713) 243-3233
Richard J. Pickert, CFA
rpickert@chiltonreit.com
(713) 243-3211
RMS: 2057 (8.31.2020) vs 2402 (12.31.2019) vs 346 (3.6.2009) and 1330 (2.7.2007)
Previous editions of the Chilton Capital REIT Outlook are available at www.chiltonreit.com/category/library/reit-outlook/.
An investment cannot be made directly in an index. The funds consist of securities which vary significantly from those in the benchmark indexes listed above and performance calculation methods may not be entirely comparable. Accordingly, comparing results shown to those of such indexes may be of limited use.
The information contained herein should be considered to be current only as of the date indicated, and we do not undertake any obligation to update the information contained herein in light of later circumstances or events. This publication may contain forward looking statements and projections that are based on the current beliefs and assumptions of Chilton Capital Management and on information currently available that we believe to be reasonable, however, such statements necessarily involve risks, uncertainties and assumptions, and prospective investors may not put undue reliance on any of these statements. This communication is provided for informational purposes only and does not constitute an offer or a solicitation to buy, hold, or sell an interest in any Chilton investment or any other security.
for more info on our strategy
go now →
for more info on our strategy
go now →
VIEW CHILTON'S LATEST
Media Features
go now →
Contact Us
READ THE LATEST
REIT Outlook
go now →
disclaimers
terms & conditions & FORM ADV
SITE CREDIT
Navigate
HOME
TEAM
REITS 101
Approach
OUTLOOKS
media
Contact
back to top
VISIT CHILTON CAPITAL MANAGEMENT
This property and any marketing on the property are provided by Chilton Capital Management, LLC and their affiliates (together, "Chilton"). Investment advisory services are provided by Chilton, an investment adviser registered with the SEC. Please be aware that registration with the SEC does not in any way constitute an endorsement by the SEC of an investment adviser’s skill or expertise. Further, registration does not imply or guarantee that a registered adviser has achieved a certain level of skill, competency, sophistication, expertise or training in providing advisory services to its advisory clients. Please consider your objectives before investing. A diversified portfolio does not ensure a profit or protect against a loss. Past performance does not guarantee future results. Investment outcomes, simulations, and projections are forward-looking statements and hypothetical in nature. Neither this website nor any of its contents shall constitute an offer, solicitation, or advice to buy or sell securities in any jurisdictions where Chilton is not registered. Any information provided prior to opening an advisory account is on the basis that it will not constitute investment advice and that we are not a fiduciary to any person by reason of providing such information. Any descriptions involving investment process, portfolio construction or characteristics, investment strategies, research methodology or analysis, statistical analysis, goals, risk management are preliminary, provided for illustration purposes only, and are not complete and will not apply in all situations. The content herein may be changed at any time in our discretion . Performance targets or objectives should not be relied upon as an indication of actual or projected future performance. Investment products and investments in securities are: NOT FDIC INSURED • NOT A DEPOSIT OR OTHER OBLIGATION OF,OR GUARANTEED BY A BANK • SUBJECT TO INVESTMENT RISKS, INCLUDING POSSIBLE LOSS OF THE PRINCIPAL AMOUNT INVESTED. Investing in securities involves risks, and there is always the potential of losing money when you invest in securities including possible loss of the principal amount invested. Before investing, consider your investment objectives and our fees and expenses. Our advisory services are designed to assist clients in achieving discrete financial goals. They are not intended to provide tax advice, nor financial planning with respect to every aspect of a client’s financial situation, and do not incorporate specific investments that clients hold elsewhere. Prospective and current clients should consult their own tax and legal advisers and financial planners. For more details, see links below to CRS (Part 3 of Form ADV) for natural person clients; Part 2A and 2B of Form ADV for all clients regarding important disclosures.