More to Net Lease REITs than Interest Rates | June 2021
June 2, 2021
Unlike most REIT sectors that refer to the real estate’s use or property type, the net lease subsector is the only one that refers to a specific lease structure, which can be used in multiple property types. In a net lease structure, the responsibility to pay certain expenses is shifted from the landlord to the tenant, transferring risk from the lessor of the property to the lessee. The most common net lease structure that publicly traded net lease REITs enter into are “triple net” leases, where the three “nets” typically refer to: (1) property taxes, (2) insurance, and (3) maintenance capital expenditures. This is in contrast to the more traditional gross lease structure where the landlord is responsible for all such property level expenses.
Net leases are typically long duration, spanning up to 30 years. In stark contrast to short term leases that can be as short as one day (e.g. hotels), long term leases are generally viewed by investors as being lower risk given the higher level of certainty of future cash flows. In a long term lease, cash flows are more or less certain absent a tenant credit event (i.e. bankruptcy). This is in stark contrast to hotel revenues which may not be known until the day of.
However, one downside of long term leases is an inability to reset to higher rent levels during periods of high inflation or economic growth. While hotels can increase rates overnight, long term leases typically have to wait until the end of the lease in order mark the rent to market. To protect landlords from inflation, net leases sometimes have contingent lease escalators that are based on the Consumer Price Index (or CPI). These CPI-based contracts typically state that the next year’s rent increase is to be based on the lesser of the change in CPI or a specified lower limit (typically 1%). This allows rents to reset higher when CPI increases, but hedges downside risk by keeping rent growth positive during periods of deflation or negative CPI growth. So while a hotel’s Revenue Per Available Room (RevPAR) may decline during recessions, net leases usually maintain a minimum of 1% revenue growth.
While REITs with long lease terms tend to underperform during periods of inflation due to declining real (i.e. inflation adjusted) cash flows, net lease properties and REITs are partially protected due to their CPI-based adjustment. This partial inflation protection along with consistent defensive cash flows during downturns make shares of net lease REITs an attractive fixed income alternative.
Given our investment framework at Chilton rewards organic cash flow growth and low NAV premiums, the net lease sector has historically been an underweight allocation in the Chilton REIT Composite relative to the benchmark. However, as shown in Figure 1, despite lower relative levels of organic growth and persistent premiums to NAV, we cannot overlook the impressive total returns of net lease REITs. From 1993 to April 30, 2021, net lease REITs have produced compound annual total returns of 12.6%, which compares to an average compound annual return of 10.7% for major property sectors (Office, Industrial, Retail, Healthcare, Residential).

Financiers
Unlike the majority of real estate owners that take an active approach to managing a property and add value through managerial expertise, the net lease structure lends itself to a passive approach that in substance more accurately resembles a financial company business model (i.e. a bank). For example, if a net lease REIT were to enter in a sale leaseback agreement with a company, whereby the REIT purchased the company’s headquarters for $100 million and entered into a sale leaseback agreement at a 5% lease yield ($5 million annual lease payments to the REIT), the result would be an effective $100 million loan to the company with an interest rate of 5%. The company now has $100 million of additional capital to invest into its core operating business, which should strengthen the tenant’s credit profile, creating a win-win for both parties!
Need For External Growth
While most REIT sectors acquire assets as a way to grow earnings, many are limited by management’s breadth of expertise (often just one property type or geographic region). Unlike other REIT sectors that acquire assets to operate them, net lease REITs acquire real estate for the purposes of providing financing to operators. This lack of operational exposure to the underlying real estate allows virtually any property with strong fundamentals to be a potential acquisition candidate for net lease REITs. This creates an opportunity for net lease REITs as they benefit from an investable universe that is vastly larger than other REIT sectors. Furthermore, the passive approach enables massive economies of scale. For example, net lease REITs rarely (if at all) need a regional office as all of the on-site duties are the responsibility of the tenant.
However, to fund a high level of external growth, net lease REITs must actively raise capital for acquisitions, making costs of capital paramount. REIT Weighted Average Costs of Capital (or WACC) are often approximated using the REIT’s implied cap rate. The implied cap rate is the Net Operating Income (property income minus property expenses, or NOI) yield that is implied by the REITs current enterprise value. In other words, the implied cap rate is a blended return that the market requires on the stock. Said another way, this is the return that the company would get by buying back its own stock.
While a REIT can fund external growth by issuing equity at any price and be successful in growing its asset base, it will only be successful in growing AFFO per share if the REIT’s implied cap rate is below the acquisition cap rate. Usually, this occurs when the stock is trading at a premium to NAV (or Net Asset Value). NAV is calculated by dividing net operating income by the private market cap rate minus liabilities to determine the equity value if the portfolio were to be sold on the private market. We can then compare the market share price of the stock to the NAV per share to determine if the stock is at a premium or discount to NAV. As shown in Figure 2, given the large acquisition universe for net lease REITs relative to other sectors that are more limited in scope, net lease REITs have persistently traded at a premium to NAV (28% historical average compared to 0% for all property types).

AFFO Per Share Growth is Holy Grail for Net Lease
The analysis of cost of capital, NAV premium, and historical capital allocation help us to arrive at an AFFO per share estimate, which we believe is the most important determinant of future share price performance for net lease REITs. Armed with the various pieces of the external growth puzzle, investors can back into AFFO per share growth from acquisitions, which is a function of: (1) the REIT’s investment spread (acquisition cap rate minus implied cap rate), and (2) the REIT’s asset base growth (acquisitions / beginning asset base).
This arithmetic naturally rewards REITs that: (1) close high levels of acquisition volumes relative to their size, and (2) trade at rich premiums to their private market value.
For example, looking back to 2019 (see Figure 3), Spirit Realty (NYSE: SRC) was successful in closing $1.3bn of acquisitions on an asset base of $4.8bn, resulting in asset base growth of greater than 25% in just one year (best in class among REIT peers). However, SRC’s investment spread of only 51bps, resulted in minimal AFFO per share growth (+1.9%). Realty Income (NYSE: O) and STORE Capital (NYSE: STOR), on the other hand, grew their asset base at a slower pace (22-23%), but with investment spreads of > 150bps. O’s and STOR’s superior costs of capital enabled them to translate external growth into significant AFFO per share growth (+6-8%).

This results in a scenario of “haves” and “have-nots”, where net lease REITs that don’t have the favorable cost of capital tend to acquire less as their efforts will results in significantly less AFFO per share growth. One salient example of a “have not” is VEREIT (NYSE: VER), which despite its size has closed on relatively few acquisitions in recent years due to its high cost of capital. After several years of having its external growth engine turned off and experiencing below-peer AFFO per share growth, it was announced on April 29, 2021, that VER would be acquired by O in an all-stock transaction.
While on average, net lease REITs trade at a premium to NAV resulting in wide investment spreads, costs of capital can quickly diminish due to adverse conditions, such as the pandemic (see Figure 4). While external growth held up relatively well in 2020 with REITs still being able to grow assets by 13.1%, depressed share prices resulted in investment spreads falling to 86bps in 2020 from 129bps in 2019. While positive investment spreads meant net lease REITs were not priced out of the market, AFFO per share growth declined to 1.9% in 2020 from 3.8% in 2019.

Despite the external growth opportunity laid out above, investors may still question the merits of buying a net lease REIT share at an implied cap rate of 5.4% (average implied cap rate of O, NNN, STOR, SRC, and VER) versus buying a net leased property outright at an cap rate of 7.2% (average applied cap rate of O, NNN, STOR, SRC, and VER; essentially the cap rate at which the portfolio would trade in the private market).
The first reason for paying a premium is liquidity. The ease at which an investor can buy and sell REIT shares compared to a private market transaction which could take months, makes REIT shares far more liquid than private assets.
The second reason is diversification. Most net lease REITs have portfolios that not only span across a wide range of property types, but also a wide range of tenants and geographies (rarely does one tenant represent more than 10% of a REITs annual base rent). By aggregating properties with underlying risk factors that are uncorrelated, net lease REITs are able to create a portfolio of risky assets that as a whole behaves more like a low risk asset with a lower standard deviation of cash flows.
Net Lease REITs and Interest Rates
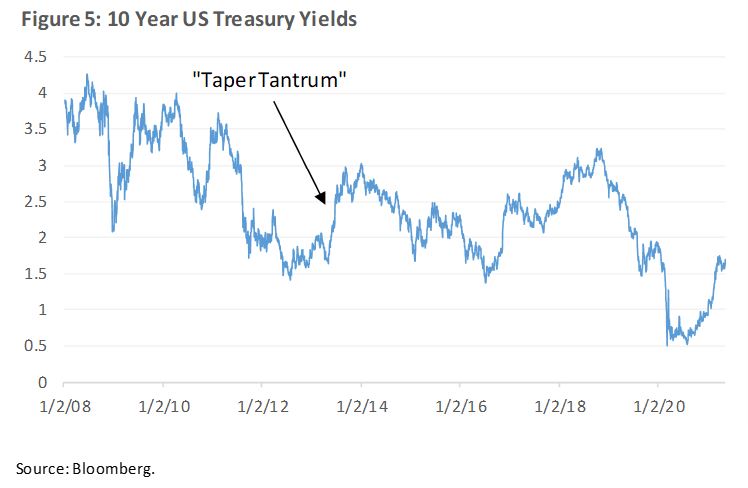
Due to the perception of net lease REITs being fixed income alternatives, it should come as no surprise that many net lease REITs have an uncanny correlation with interest rates. However, this correlation only started in earnest during an event known as the “Taper Tantrum”. The Taper Tantrum occurred in April 2013 when the Federal Reserve announced it would be tapering its policy of quantitative easing (purchasing of bonds), which then resulted in a surge in 10 year Treasury yields (see Figure 5).
From April 2013 until January 2020, there was a correlation of -66% between net lease FFO multiples and 10 year Treasury yields (see Figure 6).

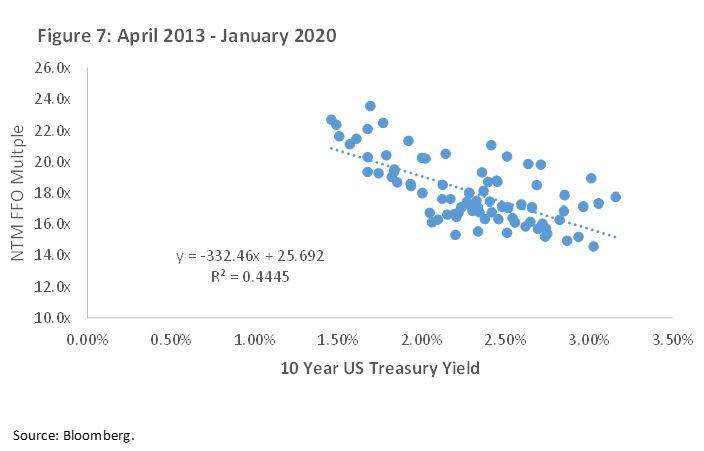
Similarly, as shown in Figure 7, the monthly intervals between April 2013 (i.e. the Taper Tantrum) and January 2020 (i.e. before the start of COVID), reveals a relatively strong correlation with an R-Squared of 0.44.
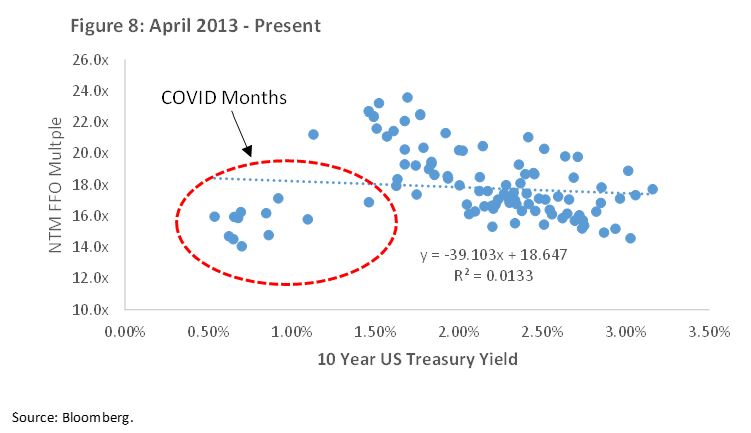
However, Figure 8 reveals that by simply including the 17 months since the start of pandemic, the R-Squared weakens materially to only 0.01. This means that one could erroneously conclude that there was virtually no correlation between 10 year Treasury yields and net lease REIT share prices over the past eight years.
More Than Just Retail
Historically, net lease REITs have focused on acquiring standalone single tenant retail properties, many of which were outparcels (i.e. a freestanding parcel of commercial real estate located in the front of a larger shopping center or strip mall). However, as shown in Figure 9, net lease REITs have since widened their horizons to various property types that exhibit strong fundamentals.
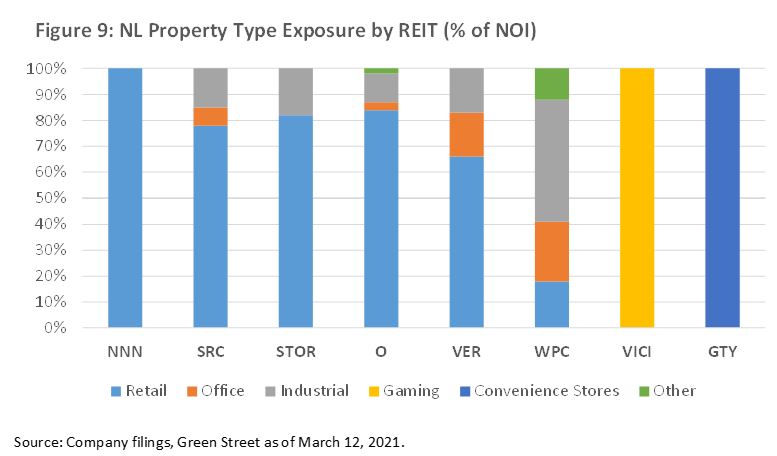
Many of the traditional net lease REITs that historically targeted standalone single tenant retail properties have expanded their portfolio holdings to include office and industrial properties.
It is also not uncommon for corporations with large real estate footprints to spin out their real estate assets into a REIT, while simultaneously entering into a sale-leaseback agreement with the remaining operating company, often utilizing net leases. This results in the operating portion of the company becoming a tenant of the newly formed REIT. While this creates a favorable tax structure for shareholders since REITs (unlike C-corporations) are not subject to double taxation, one drawback to this scenario is a REIT that upon formation is highly concentrated to a few or possibly just one tenant.
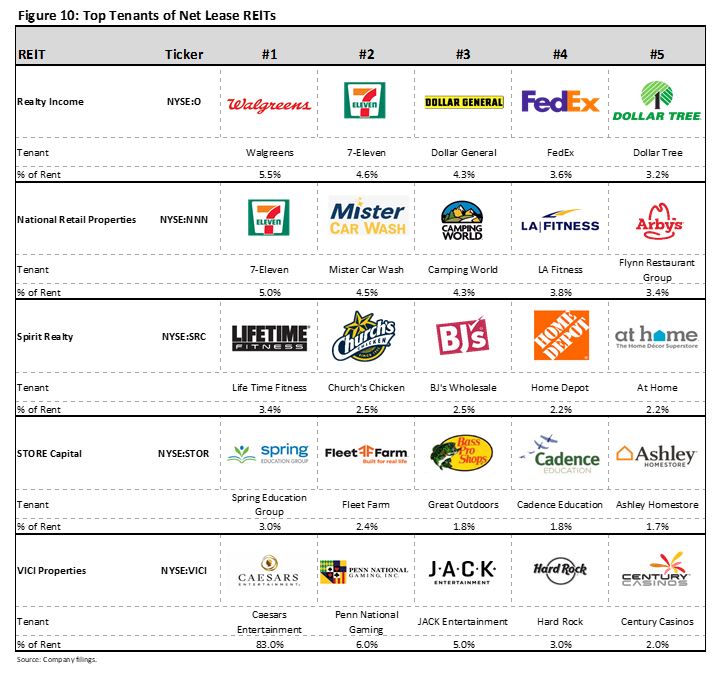
Looking to top tenants of traditional net lease REITs reveals portfolios that are well diversified across tenants and industries (top tenant rarely exceeding 10% of rent), with tenants consisting of common operating businesses that you probably see on a daily basis (see Figure 10).
A relatively nascent sub-sector of net lease REITs that focuses on gaming real estate has recently emerged, and has a particularly attractive external growth opportunity given the large relative size of casino acquisitions. The Chilton REIT Composite owns VICI Properties (NYSE: VICI), a gaming REIT with assets in Las Vegas and regional markets across the US. VICI stands out relative to its traditional net lease peers, as its formation and more narrow focus on gaming assets has resulted in a significantly higher level of tenant concentration (VICI derives 83% of its rent from Caesar’s Entertainment as 1Q21). However, VICI showed its resiliency in 2020 by collecting 100% of rents and demonstrating its ability to execute on external growth when the company announced the acquisition of the Venetian Resort in Las Vegas, NV for $4 billion, expanding VICI’s asset base by greater than 20%.
The Chilton REIT Composite also owns Getty Realty (NYSE: GTY), a net lease REIT that owns almost exclusively convenience stores. While the pandemic was at its height and many non-essential business were forced to close, we were pleased that GTY’s properties largely remained open and rent collection never dropped below 95%. Given our cautious views on retail (see the November 2020 Chilton REIT Outlook titled ‘Essential REIT Evaluation: Retail’), we favor net lease REITs that own properties that have relatively low risk to e-commerce such as gaming real estate and convenience stores.
In summary, there are many advantages to the triple net lease, and the public market offers many different REITs that use it to create value for shareholders. While on the surface they may seem to be a play on interest rates, the unique strategies and underlying properties warrant a more robust research process to determine the future performance of each REIT. We believe our current triple net REITs (VICI and GTY) provide an attractive risk-adjusted return scenario going forward that should succeed in multiple interest rate scenarios, including the base case of higher inflation in the near term.
Kevin Egan, CPA
kegan@chiltonreit.com
(713) 243-3211
Matthew R. Werner, CFA
mwerner@chiltonreit.com
(713) 243-3234
Bruce G. Garrison, CFA
bgarrison@chiltonreit.com
(713) 243-3233
RMS: 2634 (5.31.2021) vs 2220 (12.31.2020) vs 346 (3.6.2009) and 1330 (2.7.2007)
Previous editions of the Chilton Capital REIT Outlook are available at www.chiltonreit.com/category/library/reit-outlook/.
An investment cannot be made directly in an index. The funds consist of securities which vary significantly from those in the benchmark indexes listed above and performance calculation methods may not be entirely comparable. Accordingly, comparing results shown to those of such indexes may be of limited use.
The information contained herein should be considered to be current only as of the date indicated, and we do not undertake any obligation to update the information contained herein in light of later circumstances or events. This publication may contain forward looking statements and projections that are based on the current beliefs and assumptions of Chilton Capital Management and on information currently available that we believe to be reasonable, however, such statements necessarily involve risks, uncertainties and assumptions, and prospective investors may not put undue reliance on any of these statements. This communication is provided for informational purposes only and does not constitute an offer or a solicitation to buy, hold, or sell an interest in any Chilton investment or any other security.
for more info on our strategy
go now →
for more info on our strategy
go now →
VIEW CHILTON'S LATEST
Media Features
go now →
Contact Us
READ THE LATEST
REIT Outlook
go now →
disclaimers
terms & conditions & FORM ADV
SITE CREDIT
Navigate
HOME
TEAM
REITS 101
Approach
OUTLOOKS
media
Contact
back to top
VISIT CHILTON CAPITAL MANAGEMENT
This property and any marketing on the property are provided by Chilton Capital Management, LLC and their affiliates (together, "Chilton"). Investment advisory services are provided by Chilton, an investment adviser registered with the SEC. Please be aware that registration with the SEC does not in any way constitute an endorsement by the SEC of an investment adviser’s skill or expertise. Further, registration does not imply or guarantee that a registered adviser has achieved a certain level of skill, competency, sophistication, expertise or training in providing advisory services to its advisory clients. Please consider your objectives before investing. A diversified portfolio does not ensure a profit or protect against a loss. Past performance does not guarantee future results. Investment outcomes, simulations, and projections are forward-looking statements and hypothetical in nature. Neither this website nor any of its contents shall constitute an offer, solicitation, or advice to buy or sell securities in any jurisdictions where Chilton is not registered. Any information provided prior to opening an advisory account is on the basis that it will not constitute investment advice and that we are not a fiduciary to any person by reason of providing such information. Any descriptions involving investment process, portfolio construction or characteristics, investment strategies, research methodology or analysis, statistical analysis, goals, risk management are preliminary, provided for illustration purposes only, and are not complete and will not apply in all situations. The content herein may be changed at any time in our discretion . Performance targets or objectives should not be relied upon as an indication of actual or projected future performance. Investment products and investments in securities are: NOT FDIC INSURED • NOT A DEPOSIT OR OTHER OBLIGATION OF,OR GUARANTEED BY A BANK • SUBJECT TO INVESTMENT RISKS, INCLUDING POSSIBLE LOSS OF THE PRINCIPAL AMOUNT INVESTED. Investing in securities involves risks, and there is always the potential of losing money when you invest in securities including possible loss of the principal amount invested. Before investing, consider your investment objectives and our fees and expenses. Our advisory services are designed to assist clients in achieving discrete financial goals. They are not intended to provide tax advice, nor financial planning with respect to every aspect of a client’s financial situation, and do not incorporate specific investments that clients hold elsewhere. Prospective and current clients should consult their own tax and legal advisers and financial planners. For more details, see links below to CRS (Part 3 of Form ADV) for natural person clients; Part 2A and 2B of Form ADV for all clients regarding important disclosures.