Lodging REITs: Valuations Already Reflect Improvements | March 2023
March 1, 2023
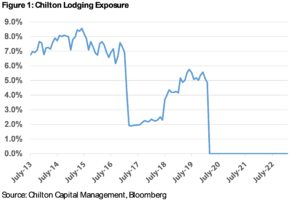
Every facet of the real estate industry was upended by Covid-19 and ensuing lockdowns, but arguably no industry saw a more material impact than travel and lodging. We sold the entirety of our lodging exposure during March of 2020 (going from ~5% in early 2020 to 0% by the end of March) as we anticipated lockdowns to have a material and extended impact on business travel (see Figure 1 for a lookback at our lodging exposure). Recall, conferences were cancelled, and business travel all but dried up as workers eschewed in-person meetings. Our exit proved prescient as the lodging sector was among the worst performing REIT sectors in both 2020 and 2021. However, the pent-up leisure demand surprised most observers resulting in a rapid recovery that began in late 2021, and was arguably the most powerful turnaround in history. As a result, the lodging sector flipped to being one of the top three REIT subsectors in 2022 with a -10.9% return versus the MSCI US REIT Index (Bloomberg: RMZ) total return of -24.5%. Fortunately, lodging REITs only made up between 3-4% of the index at the time, which minimized the impact to our relative performance.

As we look across the space today, we see several longer term potential structural tailwinds – specifically – (1) returning business- and group-oriented travel, (2) normalizing labor market with some margin-enhancing measures remaining in place (e.g., daily cleaning), (3) continued millennial and broader societal preference for experiential spending, and (4) a relatively modest supply backdrop. Still, from a stock performance standpoint, we believe current hotel REIT valuations already reflect the rapid recovery in operating fundamentals. In addition, given the historical correlation between hotel operations and GDP growth, we struggle to enter the space ahead of a broader economic slowdown. Therefore, despite cautious optimism building in 2023, we remain on the sidelines for lodging.
Impact Since 2019
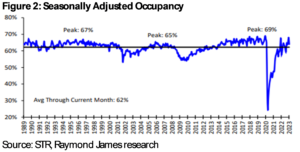
Lodging revenue is driven by two inputs – occupancy and room rate (herein referred to as ADR or average daily rate) – which combine to provide the industry standard metric RevPAR (or revenue per available room). Obviously, occupancy was highly impacted at the onset of COVID, falling to an industry wide average of nearly 20% in March/April 2020. To put that in perspective, average occupancy going back to the late 1980’s has been 62%, and coming out of the Great Financial Crisis (GFC) occupancy bottomed out at 50%! Immediately preceding the pandemic, industrywide occupancy had reached an all-time high of 69% as seen in Figure 2.

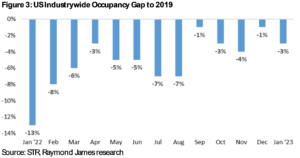
Despite this sharp decline, occupancy rebounded at an impressive pace. In Figure 3 we highlight the monthly industrywide occupancy gap versus 2019 (which as we showed above – was near all-time highs for much of the year). Even in 2022, occupancy levels remained under material pressure averaging ~5% below 2019 levels. With that said, the back half of the year displayed a marked improvement with December finishing the year a mere 1% off from 2019 occupancy.

Turning to the other piece of the RevPAR equation, average daily rate (ADR) also experienced an unprecedented drop in early 2020 but has also rebounded quicker than expected. Indeed, as pent-up travel demand combined with strong consumer spending, hotels have been able to overcome many inflationary cost pressures by meaningfully increasing daily rates.
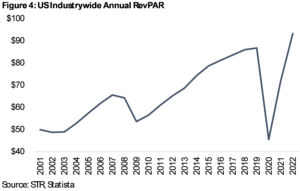
Combining occupancy and ADR, as highlighted in Figure 4, industrywide RevPAR fell nearly 50% in 2020. On an individual month basis, March and April of 2020 RevPAR declined by as much as 80%! For perspective, the annual declines seen after 2001 and 2008 were only in the 10-20% range. Conversely, in 2021, the lodging industry saw RevPAR grow nearly 60% followed by an estimated 30% gain in 2022. Overall, the pandemic impact was much sharper than prior cycles on both the downside and upside. Shockingly, RevPAR eclipsed the prior cycle peak in only three years! In contrast, it took 6 years to reach the prior cycle peak after the GFC. The question now is whether RevPAR can continue setting records in 2023 and beyond.

Uneven Recovery
While industrywide traditional performance metrics (RevPAR) are back above 2019 levels, the recovery path has been different depending on hotel type and location. In general, lodging REIT portfolios tend to tilt towards upscale/upper-upscale properties in urban locations. One REIT with somewhat of an outlier portfolio is Apple Hospitality REIT (NYSE: APLE), which focuses on upper midscale to upscale properties in secondary and tertiary markets. Conversely, Pebblebrook Hotel Trust (NYSE: PEB) is exclusively upper upscale to luxury and retains one of the highest weightings to urban locations in primary markets. Unsurprisingly, as of 2/28/23, PEB generated a -18% annualized total return since 1/1/2020, while APLE produced a +3% annualized total return for the same period.
Business Travel – Group vs. Transient
Although leisure travel performed quite well following the initial stages of the pandemic (driven by work from home, government stimulus, etc.), the recovery in business travel has been far slower. Business travel is further broken down into two parts – transient and group. Group travel is driven by conferences and large scale meetings, while business transient includes everything else business-related. Group bookings were initially under the most pressure (going to effectively zero for much of 2020), but there has been cautious optimism building for 2023 and consensus seems to think group travel could be back to normal (2019 levels) by the later part of 2023. However, most management teams remained cautious for business transient, expecting ~2 years before getting back to normal. The bullish case for lodging would be if leisure demand holds steady and business transient is able to recover to 2019 levels – we remain skeptical.
Supply Backdrop
New supply has been a headwind for the lodging industry during much of recent history. However, as we look at the pandemic’s impact on the pipeline of new hotel construction, it is important to remember that planning and construction typically takes several years. Currently, the industry is expecting a moderate wave of deliveries this year, with supply expected to be muted afterwards. Near term supply is heavily weighted towards NYC, with 61 projects totaling ~10,000 rooms currently under construction (off an existing base of ~140,000 rooms). Other markets with meaningful construction are Phoenix at 29 projects (~5,500 rooms), Atlanta (27 projects/ 4,300 rooms), and Dallas (23 projects/ 3,400 rooms).
Risks – Recession and Labor
First and foremost, the lodging industry is historically highly correlated to GDP growth. While the U.S. consumer has been holding up much better than feared, the potential for a recession this year makes it difficult for us to own lodging in the near term.
Furthermore, hotel operating margins look very different at 25% occupancy versus 65% (historically average occupancy is 62%). Hotel operators were forced to let go of many workers during 2020 and are now having a difficult time hiring back employees. While we agree that the labor market should soften over the coming year, initial operating expense guidance for 2023 has been disappointing. Host Hotels & Resorts (NYSE: HST) was one of the few lodging REITs to issue full year 2023 guidance, with the midpoint of management’s FFO range arriving ~8% below consensus. Most concerning, the guidance assumptions imply that operating margins deteriorate in 2023 versus 2022 due principally to labor. Overall, while we do expect operating efficiencies to improve margins above pre-COVID levels in the long run, this is likely more of a 2024 event, at the earliest.
Portfolio Positioning
Clearly we did not foresee the rapid V-shaped recovery in lodging REITs last year. However, looking at stock performance we think much of the upside has already been priced in. Specifically, since the start of 4Q22 the average lodging REIT (Bloomberg: BBREHOTL Index) gained ~18% while the RMZ is only up ~10%. Following this outperformance, as of the end of January, the REIT lodging group is trading at an average P/FFO (price to funds from operations) multiple of 9.8x. For comparison, at the end of 2019, based off 2020 FFO estimates at the time, the group was trading at a 9.5x average FFO multiple while the longer term average is ~10.5x. Although today’s FFO multiple stands slightly below the long term average multiple, we do not consider the group attractive at current levels considering the aforementioned headwinds coupled with the impact that rising interest rates could have on earnings growth.
Conclusion
Despite suffering from the largest annual RevPAR decline on record in 2020 (according to STR), the lodging industry has roared back over the past ~18 months with an equally impressive V-shaped recovery. Indeed, the level of pent-up leisure travel demand surprised most forecasts – leading lodging REITs to be one of the top performing subsectors in 2022. However, observing the group today, several factors give us reason for pause. First, lodging remains highly correlated to GDP growth and economic activity. Second, labor, although improving, is still a headwind this year (see recent guidance updates). Finally, following the recent outperformance in lodging REITs, valuations are in line with pre-pandemic levels. Overall, we see stronger risk-adjusted total return prospects in other property types. As such, we remain in a wait-and-see approach with no current exposure to lodging REITs or traditional lodging stocks in our portfolio.
Thomas P. Murphy, CFA
tmurphy@chiltoncapital.com
(713) 243-3211
Matthew R. Werner, CFA
mwerner@chiltoncapital.com
(713) 243- 3234
Bruce G. Garrison, CFA
bgarrison@chiltoncapital.com
(713) 243-3233
Isaac A. Shrand
ishrand@chiltoncapital.com
(713) 243-3219
RMS: 2,526 (2.28.2023) vs. 2,398 (12.31.2022) vs. 3,177 (12.31.2021) vs. 1,433 (3.23.2020) and 2,560 (2.21.2020)
An investment cannot be made directly in an index. The funds consist of securities which vary significantly from those in the benchmark indexes listed above and performance calculation methods may not be entirely comparable. Accordingly, comparing results shown to those of such indexes may be of limited use.)
The information contained herein should be considered to be current only as of the date indicated, and we do not undertake any obligation to update the information contained herein in light of later circumstances or events. This publication may contain forward looking statements and projections that are based on the current beliefs and assumptions of Chilton Capital Management and on information currently available that we believe to be reasonable, however, such statements necessarily involve risks, uncertainties and assumptions, and prospective investors may not put undue reliance on any of these statements. This communication is provided for informational purposes only and does not constitute an offer or a solicitation to buy, hold, or sell an interest in any Chilton investment or any other security. Past performance does not guarantee future results.
Leave a Reply Cancel reply
for more info on our strategy
go now →
for more info on our strategy
go now →
VIEW CHILTON'S LATEST
Media Features
go now →
Contact Us
READ THE LATEST
REIT Outlook
go now →
disclaimers
terms & conditions & FORM ADV
SITE CREDIT
Navigate
HOME
TEAM
REITS 101
Approach
OUTLOOKS
media
Contact
back to top
VISIT CHILTON CAPITAL MANAGEMENT
This property and any marketing on the property are provided by Chilton Capital Management, LLC and their affiliates (together, "Chilton"). Investment advisory services are provided by Chilton, an investment adviser registered with the SEC. Please be aware that registration with the SEC does not in any way constitute an endorsement by the SEC of an investment adviser’s skill or expertise. Further, registration does not imply or guarantee that a registered adviser has achieved a certain level of skill, competency, sophistication, expertise or training in providing advisory services to its advisory clients. Please consider your objectives before investing. A diversified portfolio does not ensure a profit or protect against a loss. Past performance does not guarantee future results. Investment outcomes, simulations, and projections are forward-looking statements and hypothetical in nature. Neither this website nor any of its contents shall constitute an offer, solicitation, or advice to buy or sell securities in any jurisdictions where Chilton is not registered. Any information provided prior to opening an advisory account is on the basis that it will not constitute investment advice and that we are not a fiduciary to any person by reason of providing such information. Any descriptions involving investment process, portfolio construction or characteristics, investment strategies, research methodology or analysis, statistical analysis, goals, risk management are preliminary, provided for illustration purposes only, and are not complete and will not apply in all situations. The content herein may be changed at any time in our discretion . Performance targets or objectives should not be relied upon as an indication of actual or projected future performance. Investment products and investments in securities are: NOT FDIC INSURED • NOT A DEPOSIT OR OTHER OBLIGATION OF,OR GUARANTEED BY A BANK • SUBJECT TO INVESTMENT RISKS, INCLUDING POSSIBLE LOSS OF THE PRINCIPAL AMOUNT INVESTED. Investing in securities involves risks, and there is always the potential of losing money when you invest in securities including possible loss of the principal amount invested. Before investing, consider your investment objectives and our fees and expenses. Our advisory services are designed to assist clients in achieving discrete financial goals. They are not intended to provide tax advice, nor financial planning with respect to every aspect of a client’s financial situation, and do not incorporate specific investments that clients hold elsewhere. Prospective and current clients should consult their own tax and legal advisers and financial planners. For more details, see links below to CRS (Part 3 of Form ADV) for natural person clients; Part 2A and 2B of Form ADV for all clients regarding important disclosures.