Public Office REITs: Where is the Bottom? | May 2023
May 1, 2023
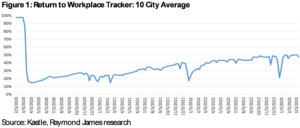
It’s no secret the office sector faces extreme stress due to the surge in remote work. Though there was some progress on return to office (RTO) last fall, technology tenants reversed a multi-year leasing spree while financing risks only added fuel to the decline in 2023. As a result of the pandemic’s ‘forced experiment’ with remote work, many companies have changed the way they view in-person office work since 2019. According to office card swipe company Kastle, office utilization has barely reached 50% of 2019 levels as of March 2023 (Figure 1).
Though there have not been many transactions in the private market, public investors have expressed their bleak view of future office fundamentals via public office REITs. As measured by the Bloomberg REIT Office Property Index (Bloomberg: BBREOFPY) public office REITs have produced a total return of -47.9% from 3/31/22 through 3/31/23, which compares to -19.2% for the MSCI US REIT Index (Bloomberg: RMZ). While the relative underperformance prices in a drastic scenario for office fundamentals, it is difficult for us to have conviction in a recovery given the challenges that office owners will face over the next 12-24 months.
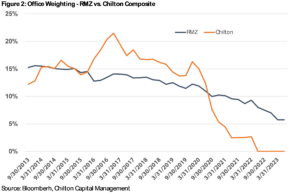
These negative factors are overly prominent in the current news cycle, and the narrative typically conflates office specific fundamentals with the broader REIT universe. Before we go any further, let us address the myth that public REITs are heavily comprised of office. The truth is that office only makes up 5.6% of the MSCI US REIT Index (Bloomberg: RMZ) as of 4/30/23. Moreover, as shown below in Figure 2, the Chilton Composite has held zero direct office exposure since June 2022, and has been underweight since September 2020.
However, office comprises a much larger portion of private real estate industry (~17% of total CMBS debt, and almost 25% of the NCREIF Property Index), which we believe will be the subject of most of the near-term negative headlines in the media. In particular, while public office REITs are pricing in material distress, private office funds have not been meaningfully marked down despite typically higher leverage and lower quality assets than the public REITs.
Our underweight to the office sector has served performance well, generating 142 bps of alpha year to date through 4/20/23. At some point, the risk/reward balance will be too difficult to ignore. However, we believe fundamentals need to improve (or stop declining) or prices need to decline further before we feel comfortable investing in the group.
Before delving into the details behind our thesis, we highlight the five fundamental beliefs that underpin our office positioning:
- Hybrid work is here to stay, but even hybrid work requires office space. Once companies adjust to the new normal office space needs per employee (often called ‘density’), demand should increase alongside employment growth.
- Bifurcation of quality is increasing at a higher rate than ever. This means obsolescence will cure many of the vacancy issues.
- Tech downsizing and recession pressures remain a headwind for leasing activity, though, by definition, every cycle eventually bottoms and recovers to a higher peak.
- Near term debt maturities during a time of tightening lending standards will be the catalyst for distress.
- Well-capitalized owners with minimal future capital commitments will be in an advantageous position to acquire high quality buildings at attractive prices.
New Normal Includes Hybrid Work
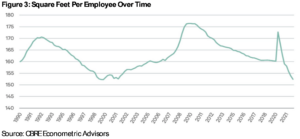
As shown in Figure 3, the average square feet per employee had been trending higher from 2000 to the onset of the Global Financial Crisis (or GFC). However, that trend flipped significantly after the recession and had been on a fairly steep downward trajectory before the pandemic. However, in a situation where every employee goes into office Tuesday-Thursday, the employer would not be able to reduce its space. Overall, office reconfigurations and ideas such as ‘hot desking’ should reduce density needs, but maybe not as severely as some anticipate.
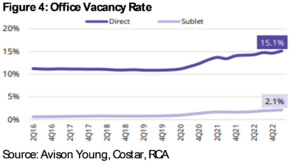
Highlighted in Figure 4, the impact of remote work is already reflected in higher office vacancies. Additionally, the lighter blue line tracks sublease availability, which is a form of shadow supply that presents another headwind as it has been increasing over the past few years.
Setting aside opinions on remote work, we believe that hybrid work will constitute a large part of the “new normal” and, therefore, density requirements could be less than they were pre pandemic. With that said, we do not believe remote work can replace in-person collaboration. Furthermore, return to office (or RTO) mandates have started to pick up recently. All else equal, more companies will be downsizing space than increasing space in the near term, but companies that want to instill a culture that attracts loyal, high quality employees will continue to have in-office needs.
Flight to Quality = More Obsolescence
One major positive for public office REITs today is the amount of potential obsolescence across the broader industry. In our view, today’s situation goes well beyond exceptionally old stock that is falling apart. Stepping back, given employee resistance to RTO mandates, employers are responding by using premier office space to entice employees back into the office. As such, we believe that high quality, newly built office buildings will be the most resistant to the secular changes in how people work. Figure 5 shows that buildings completed after 2015 were the only ones with positive net absorption since March 2020. Notably, anything built before 2010 had significant negative absorption.

Can Conversions Save Office?
Looking at the magnitude of office obsolescence alongside the country’s housing affordability problem, the logical use for obsolete office buildings would appear to be a residential conversion. However, in reality, regulations and high costs make conversions a difficult proposition. Notably, bedrooms are required to have windows, which is an obstacle for buildings with large floor plates. Even with these hurdles in place, we are still seeing some conversions if the price is low enough for the buyer to justify the incremental spend. CBRE is forecasting around 20 million square feet in 2023. While this is a meaningful uptick, it is still only a drop in the bucket compared to the amount of space that we believe is obsolete.
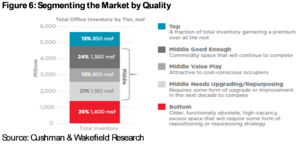
Looking at all the obstacles standing in the way of office conversions, we believe there will be more outright office demolitions in the coming years. In Figure 6 we highlight how Cushman & Wakefield segments the office market. Starting at the bottom, 25% of the market is classified as functionally obsolete today. C&W further breaks the middle of the market into three distinct categories – good enough, value play, and needs upgrading. In our view, buildings needing meaningful upgrades are probably also at risk for demolition if the credit markets remain challenged for office. Combining the functionally obsolete and needing upgrade buckets, there are almost 2.6 billion square feet at risk of obsolescence – nearly half the market. We view this as a long term positive tailwind for owners of high quality office buildings.
Development Activity Declining
Anyone developing a speculative office building faces the headwinds of faltering demand, higher land/construction costs, and, most recently, higher interest rates. It’s no surprise that speculative development has declined materially over the past few years – and recently likely reached zero. Even when we look at projects delivering in the next few quarters with significant pre-leasing, many of these projects may still turn out to be value destructive given the increase in cost of capital since these projects were announced. As one would expect, and highlighted in Figure 7 below, new developments for all office (speculative and pre-leased) slowed materially through 2022.
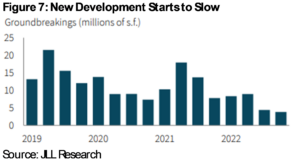
Because of the time lag between breaking ground and delivering a finished project, we still have another year or so of project deliveries that were started in the past few years. As of 12/31/22, the industry still had around 100 million square feet currently under construction, which equates to roughly 1.7% of total office supply. Though this is not above historical averages, we expect the new supply to hurt both current owners and developers considering that 42% of these projects remain unleased. As an example, Brandywine (NYSE: BDN – not in REIT Composite) announced with its 1Q2023 earnings release that it did not make any progress on leasing for any of its developments (most notably Uptown ATX in Austin, TX) in the previous quarter. In particular, management noted that demand from tech tenants had dropped dramatically (they were previously looking for a single tenant user but that appears off the table).
Private Markets – The Distress is Yet to Come
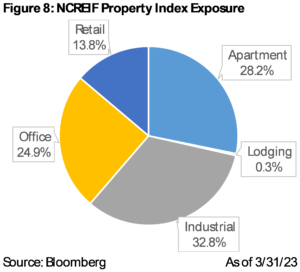
As we mentioned above, private real estate ownership has a higher exposure to office than public REIT indexes. Specifically, office accounted for almost 25% of the NCREIF Property Index (Bloomberg: NPNCRE) as of March 31, 2023 (Figure 8).
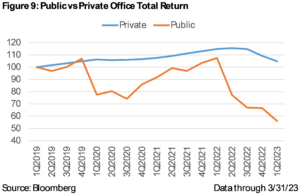
Looking at performance data, the discrepancy between private and public office returns are even more startling. The NCREIF Office Property Index (Bloomberg: NPPQOFF) produced a total return of -8.8% over the past year (ending 3/31/23). Meanwhile, public office REITs (Bloomberg: BBREOFPY) generated a total return of -47.9% over the same period, a difference of almost 4,000 basis points. As shown in Figure 9, private office values remain essentially in-line with pre-pandemic levels. In our view, markdowns are coming for most private real estate, and the office sector will be one of the most dramatic.
Adding another layer of risk, private real estate funds and owners tend to employ significantly higher leverage than their public counterparts. As an example, let’s say Investor A bought a $100 million office building seven years ago and at a 70% LTV (Loan To Value) ratio, which would require $30 million of equity. Conservatively, let’s assume the building’s value is down 25%. This means the original $30 million equity portion has been reduced to $5 million ($75 million value less $70 million loan) – equating to a decline of 83%. In addition to a decline in value, owners with loans maturing in the near term are also faced with tighter lending standards. If a bank is willing to lend at 50% LTV on the new value (and that is a big ‘IF’), Investor A would have to come up with an additional $32.5 million in equity to keep the building. Considering this is larger than the original equity contribution, it becomes clearer why many are expecting distress within the private office market.
What can Investor A do in this scenario?
- If he/she is able to sell at a 25% value decline, Investor A could hope to recoup $5 million of the initial equity (83% loss). Remember, all potential buyers are facing the same lending criteria, so unless the building is well leased and well located, Investor A might not be able to even find a buyer.
- Investor A could pony up the additional equity, focus on leasing up the building and ride out the cycle until office improves, but finding equity could be difficult and the potential returns may not justify the risks.
- Finally, Investor A could hand back the keys to the lender. We believe this will become the most common outcome, depending on asset specific criteria.
Well-Capitalized REITs are Natural Beneficiaries
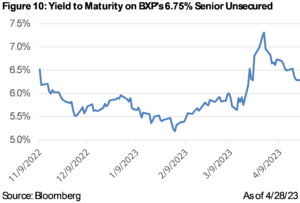
Thinking through the above scenario, well-capitalized REITs could be the natural beneficiaries of increased distress. To start with, public REIT prices have already been marked down. That’s not to say values can’t decline further, but private valuations have a lot more room to fall versus public valuations. In addition, public REITs are typically investment grade borrowers who can access the unsecured bond market and therefore not be forced sellers beholden to tougher lending standards from traditional sources such as commercial banks. For some perspective, Figure 10 shows the yield to maturity on Boston Properties (NYSE: BXP – not in REIT Composite)’s most recent unsecured note issuance maturing in December 2027. While borrowing standards have certainly tightened for public office REITs, the public financing markets remain much more open than the private markets. In a perfect scenario, the lowest leverage office REITs could take advantage of distressed sellers to pick up quality assets at bargain basement pricing like many did following the 2008-09 period.
What Brings Chilton Off The Sidelines?
Looking across our REIT universe and current valuations, office REITs are likely the most levered to improving macro fundamentals. Given how far office REITs have fallen, a “soft-landing” economic scenario with interest rate normalization and employment growth should drive outsized returns in office. For managers who judge themselves against the index, there is risk of avoiding office REITs based merely on a ‘mean reversion’ trade. However, our investment process determines buy decisions based on fundamentals. We never buy simply to “not miss out”.
With that said, deeply discounted and highly out-of-favor sectors always pique our contrarian interests, so we are sharpening our pencils on several office names. There are still too many negative catalysts weighing on the group in the near term, but we believe a sub-segment of public office REITs will win out in the long term. As we seek to underwrite a valuation floor, we are searching for the following:
- High quality balance sheet. Given the potential for several years of challenges, this is a strict prerequisite for any office investment. Any office REIT will need a well-laddered balance sheet alongside modest leverage if they expect to weather the storm.
- Well-located assets. The benefit of future obsolescence will accrue to the highest quality office owners.
- Strong tenant roster. Exposure to large, chunky leases is going to be a big headwind for the next few years. Major move outs will be hard to backfill in short order. We are stress testing 15% occupancy losses.
- Minimal development commitments. If there is meaningful development exposure it needs to be substantially pre-leased.
Thus far, there is more tenant and development risk than we are comfortable with at current valuations. We are attentively looking at lease expiration schedules and development progress to parse out the best positioned names.
Thomas P. Murphy, CFA
tmurphy@chiltoncapital.com
(713) 243-3211
Matthew R. Werner, CFA
mwerner@chiltoncapital.com
(713) 243- 3234
Bruce G. Garrison, CFA
bgarrison@chiltoncapital.com
(713) 243-3233
Isaac A. Shrand
ishrand@chiltoncapital.com
(713) 243-3219
RMS: 2,483 (4.30.2023) vs. 2,398 (12.31.2022) vs. 3,177 (12.31.2021) vs. 1,433 (3.23.2020) and 2,560 (2.21.2020)
An investment cannot be made directly in an index. The funds consist of securities which vary significantly from those in the benchmark indexes listed above and performance calculation methods may not be entirely comparable. Accordingly, comparing results shown to those of such indexes may be of limited use.)
The information contained herein should be considered to be current only as of the date indicated, and we do not undertake any obligation to update the information contained herein in light of later circumstances or events. This publication may contain forward looking statements and projections that are based on the current beliefs and assumptions of Chilton Capital Management and on information currently available that we believe to be reasonable, however, such statements necessarily involve risks, uncertainties and assumptions, and prospective investors may not put undue reliance on any of these statements. This communication is provided for informational purposes only and does not constitute an offer or a solicitation to buy, hold, or sell an interest in any Chilton investment or any other security. Past performance does not guarantee future results.
NCREIF Property Index performance is presented as a benchmark for reference only and does not imply any portfolio will achieve similar returns, volatility or any characteristics similar to any actual portfolio. The composition of a benchmark index may not reflect the manner in which any is constructed in relation to expected or achieved returns, investment holdings, sectors, correlations, concentrations or tracking error targets, all of which are subject to change over time.
Information contained herein is derived from and based upon data licensed from one or more unaffiliated third parties, such as Bloomberg L.P. The data contained herein is not guaranteed as to its accuracy or completeness and no warranties are made with respect to results obtained from its use. While every effort is made to provide reports free from errors, they are derived from data received from one or more third parties and, as a result, complete accuracy cannot be guaranteed.
Leave a Reply Cancel reply
for more info on our strategy
go now →
for more info on our strategy
go now →
VIEW CHILTON'S LATEST
Media Features
go now →
Contact Us
READ THE LATEST
REIT Outlook
go now →
disclaimers
terms & conditions & FORM ADV
SITE CREDIT
Navigate
HOME
TEAM
REITS 101
Approach
OUTLOOKS
media
Contact
back to top
VISIT CHILTON CAPITAL MANAGEMENT
This property and any marketing on the property are provided by Chilton Capital Management, LLC and their affiliates (together, "Chilton"). Investment advisory services are provided by Chilton, an investment adviser registered with the SEC. Please be aware that registration with the SEC does not in any way constitute an endorsement by the SEC of an investment adviser’s skill or expertise. Further, registration does not imply or guarantee that a registered adviser has achieved a certain level of skill, competency, sophistication, expertise or training in providing advisory services to its advisory clients. Please consider your objectives before investing. A diversified portfolio does not ensure a profit or protect against a loss. Past performance does not guarantee future results. Investment outcomes, simulations, and projections are forward-looking statements and hypothetical in nature. Neither this website nor any of its contents shall constitute an offer, solicitation, or advice to buy or sell securities in any jurisdictions where Chilton is not registered. Any information provided prior to opening an advisory account is on the basis that it will not constitute investment advice and that we are not a fiduciary to any person by reason of providing such information. Any descriptions involving investment process, portfolio construction or characteristics, investment strategies, research methodology or analysis, statistical analysis, goals, risk management are preliminary, provided for illustration purposes only, and are not complete and will not apply in all situations. The content herein may be changed at any time in our discretion . Performance targets or objectives should not be relied upon as an indication of actual or projected future performance. Investment products and investments in securities are: NOT FDIC INSURED • NOT A DEPOSIT OR OTHER OBLIGATION OF,OR GUARANTEED BY A BANK • SUBJECT TO INVESTMENT RISKS, INCLUDING POSSIBLE LOSS OF THE PRINCIPAL AMOUNT INVESTED. Investing in securities involves risks, and there is always the potential of losing money when you invest in securities including possible loss of the principal amount invested. Before investing, consider your investment objectives and our fees and expenses. Our advisory services are designed to assist clients in achieving discrete financial goals. They are not intended to provide tax advice, nor financial planning with respect to every aspect of a client’s financial situation, and do not incorporate specific investments that clients hold elsewhere. Prospective and current clients should consult their own tax and legal advisers and financial planners. For more details, see links below to CRS (Part 3 of Form ADV) for natural person clients; Part 2A and 2B of Form ADV for all clients regarding important disclosures.