Multifamily REITs: Navigating the Sun Belt Amid Record Supply | February 2024
February 1, 2024
Following a spectacular year of total returns and relative outperformance in 2021, multifamily REITs have underperformed the MSCI U.S. REIT Index (Bloomberg: RMZ). The underperformance for multifamily REITs has been a product of both the macro environment (rising interest rates) and record high apartment deliveries, especially in Sun Belt markets. While the fears are for the most part justified, the underperformance looks to be overdone, especially for those predominantly with Sun Belt exposure.
We expect coastal multifamily REITs such as AvalonBay (NYSE: AVB) and Equity Residential (NYSE: EQR) to produce stronger results in 2024 when compared to their Sun Belt peers Camden (NYSE: CPT) and Mid-America (NYSE: MAA). However, we feel that the market has already discounted the differences. Once new deliveries begin to moderate, we believe Sun Belt focused multifamily REITs should present a very compelling opportunity for investors. In addition, REIT balance sheets and superior access to capital will enable them to play a major role in recapitalizing troubled properties.
We are focused on six key themes:
1. Supply is expected to reach a 50-year high in 2024, largely concentrated in the Sun Belt;
2. Development starts are falling rapidly due to higher interest rates, leading to a favorable set up of lower supply for the back half of 2025 and all of 2026;
3. Market rents are expected to decline in the near-term, further dampening new starts;
4. Affordability of renting vs. buying and strong job and wage growth should help buoy renter demand;
5. Distress from owners with maturing multifamily CRE debt ($113 billion over the next two years) will allow well-capitalized REITs to acquire assets at accretive levels; and
6. Multifamily REITs, especially those in the Sun Belt, are attractively valued on both a multiple and implied cap rate basis compared to historical averages.
Highest Apartment Supply in 50 Years
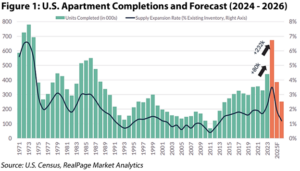
2023 marked a 36-year high for apartment units delivered since 1987. While the completion of 440,000 multifamily units last year was eye-popping, an estimated 671,000 units are scheduled to deliver in 2024, marking a new 50-year high and a 52% increase from 2023 as shown in Figure 1.
The bulk of the new supply is highly concentrated within the Sun Belt, as visualized in Figure 2 for the top-22 REIT centric markets. RealPage forecasts Sun Belt market deliveries to represent 5.5% and 2.2% of current stock for 2024 and 2025, respectively. In comparison, the major Coastal markets expect a much lower 2.1% and 1.3% of supply being delivered as a percent of total stock for 2024 and 2025.
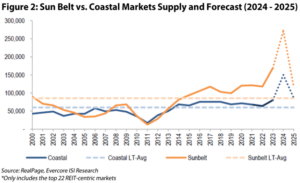
Markets such as Austin, Phoenix, and Charlotte have upwards of 14% of outstanding multifamily stock expected to deliver within the next 24 months. This same measure compares to major Coastal markets such as Los Angeles (2.4%), New York (2.7%), and Boston (3.4%) over the same time frame. However, we believe there will be a steep drop-off in deliveries which could create a supply / demand mismatch in Sun Belt cities after absorbing the new supply.
Changing Supply Dynamics
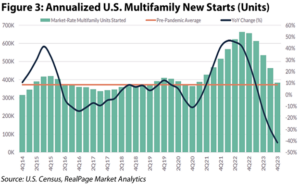
We expect supply to drop because starts have been falling due to high construction costs and insufficient returns to attract both debt and equity capital. To best illustrate, we’ll use Camden’s South Charlotte community, a project in its development pipeline that has not yet started, as an example. Assuming a total estimated cost of $153 million for 420 projected units, the cost per unit equates to ~$364,000. With a target yield of 5.5%, one would need annual net operating income (“NOI”) of $21,800 per home and, at a typical 65% NOI margin, required revenue per unit of $31,800 per year, or $2,560 on a monthly basis. Given CPT’s reported monthly revenue per occupied home is $2,069 in Charlotte for 3Q23, rents would need to rise by more than 20% over the next two years for new development starts to make sense. Given that consensus rent growth estimates are substantially lower than what’s necessary, we believe we are a long way away from merchant builders making sense of new development starts. Not surprisingly, multifamily starts were down 40%+ year-over-year in 4Q23 as shown in Figure 3.
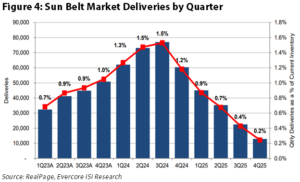
With apartment deliveries expected to peak in mid-2024, we anticipate a return to more normal, pre-pandemic deliveries by the first half of 2025 as presented in Figure 4 for the major Sun Belt markets. This drop-off in supply would not only provide the multifamily REITs with a recovery of occupancy, but also should ultimately restore pricing power and a favorable set up for earnings growth.
Key Drivers of Demand & Rent Growth
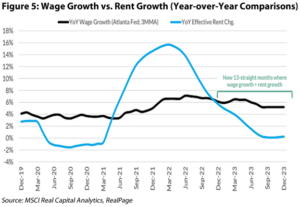
Major influences that weigh on apartment demand include job and wage growth. Job growth, though slowing, is still in great shape with 2.7 million jobs added in 2023 (216,000 of which were added in December 2023) and an overall unemployment rate of 3.7%. Similarly, wage growth remains remarkably strong with a year-over-year change of +5.2% in December 2023 (vs. inflation of +3.4%) and continued the streak of 13 straight months with wage growth higher than rent growth as shown in Figure 5, a trend that is likely to support demand going forward.
As highlighted in our last residential sector deep dive (October 2022 REIT Outlook), one of the most important factors when deciding to rent or buy a home is affordability, which is by-in-large driven by mortgage rates. According to CBRE, the average monthly new mortgage payment is roughly 52% higher than the average apartment rent as of October 2023. For context, this is the most extreme level in over 35 years leading to people having a higher propensity to rent.
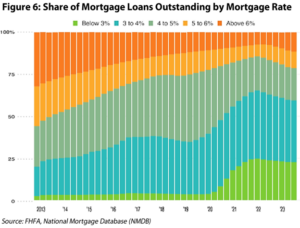
While 30-year fixed mortgage rates have come down from their recent peak of 8.0% in late October 2023 to the seemingly more reasonable 6.7% level, this is still more than double the rate just two years ago. Adding fuel to the fire for any aspiring homeowner, approximately 89% of U.S. homeowners with mortgages currently have an interest rate below 6% as visualized in Figure 6. This has prompted many individuals to ‘stay put’ rather than selling and buying another home at a higher mortgage rate, a phenomenon deemed the “lock-in effect”.
The “lock-in effect” has driven and will likely continue to drive the supply shortage of homes for sale for the foreseeable future, leaving those aspiring to buy a home unable to find a reasonable listing. While the lock-in effect isn’t expected to stimulate rental demand to the extent of fully offsetting the onslaught of oncoming multifamily supply, it should at the very least provide the multifamily REITs with some near-term stability and above-average retention rates. For example, CPT’s move-out rate for home purchases was less than 10% for December 2023, one of the lowest levels on record.
Balance Sheet Strength Provides an Opportunity
Multifamily REIT balance sheets are amongst the healthiest in the REIT universe. With low leverage at 24% (vs. ~65%+ typically seen in the private space), well staggered maturities averaging 6.7 years, and over 93% of debt outstanding being fixed at low rates, multifamily REITs are well positioned to persevere and successfully navigate through the current, more ‘stable’ rate environment. Additionally, despite the ‘stable’ rate environment consisting of elevated debt costs (~5.0%) relative to the weighted average interest rate of the REIT’s outstanding debt (~3.6%), we expect minimal headwinds to earnings growth given immaterial debt maturities and sound credit ratings, resulting in a per share impact of less than 1% per annum over the next four years according to our analysis.
Over the next 24 months, ~$320 billion of securitized CRE debt is expected to mature with multifamily making up 35% of total loans maturing ($113 billion), the largest share of any asset class. As owners begin to face these debt maturities for assets bought at sky-high prices in 2021-2022 and typically financed with variable rate debt and high loan to value ratios, they will be forced to either negotiate deferrals with lenders, recapitalize, or sell the assets. REIT management teams also believe large pockets of distress should presumably surface within the next 12-18 months, a topic we briefly discussed in our most recent NAREIT recap (December 2023 REIT Outlook). REIT management teams have steadily strengthened their balance sheets since the Global Financial Crisis, culminating towards this pivotal moment where well-capitalized REITs stand poised to reap the benefits of capturing increased market share.
Another way that well-capitalized multifamily REITs will likely take advantage of their strong balance sheets, especially those with solid development platforms such as AvalonBay, is to be the ‘first movers’ to develop assets for the forthcoming ‘new cycle’. For reference, over the past 10 years AvalonBay has delivered more than $10 billion of apartment completions, creating ~$4.4 billion in value and proving the strength of its platform. Over the next 12-18 months, development starts for most merchant builders should continue to falter resulting in the stark fall-off of apartment completions for late 2025 to 2027 (the ‘new cycle’) given the typical construction timeline of 18-24 months.
Valuation Analysis
Multifamily REITs are trading at a weighted average 14.9x multiple to 2024 consensus FFO as of January 31, 2024, which compares to the 12/31/2021 FFO multiple of 27.4x and the 20-year average of 16.9x. The current FFO multiple of 14.9x implies a ~15% discount to the REIT universe’s 17.6x. However, multifamily REITs have historically traded at a ~14% premium relative to other REITs. If multifamily REITs were to trade at the ~14% relative premium, this would imply an FFO multiple of 20.0x resulting in a 34%+ upside off today’s prices from multiple expansion alone. In addition, multifamily REITs are currently trading at a 14.0% discount to what their properties would likely sell for on the private market, according to Green Street Advisors.
Lastly, market cap rates for apartments have remained relatively sticky despite elevated interest rates, holding close to the low to mid 5% range according to RealPage. However, multifamily REITs are instead trading at implied cap rates north of 6.0% with Sun Belt multifamily REITs trading closer to 6.8%. The stark contrast between market and implied cap rates for the multifamily REITs provides further conviction on the relative value and ultimate ‘discount’ to the private market at which the multifamily REITs are trading today. For instance, if Camden were to trade at its ‘private market equivalent’ 5.5% nominal cap rate instead of the market’s implied cap rate of 6.8%, CPT’s share price would rise to $124/share, a striking ~32% increase from the $94/share present in the market as of January 31, 2024.
Conclusion
In conclusion, while we are undoubtedly concerned with the daunting level of the supply pipeline, we believe that a recovery in the fundamental strength of apartment ownership is in sight as we look to 2025.
Our current allocation within the Chilton REIT Composite tilts slightly overweight to coastal multifamily (7.7% Chilton vs. 7.2% RMZ) and roughly in-line with Sun Belt multifamily (3.4% Chilton vs. 3.3% RMZ). Over the next 12 months, we plan to strategically increase our Sun Belt exposure within the multifamily sector for the reasons outlined in this report.
*FFO = Funds from Operations = Net Income + Non-Cash Charges
**AFFO = Adjusted Funds from Operations = Net Income + Non-Cash Charges – Maintenance Capital Expenditures
***Implied Cap Rate = Net Operating Income / (Total Outstanding Debt + Total Equity Market Capitalization)
Isaac A. Shrand, CFA
ishrand@chiltoncapital.com
(713) 243-3219
Matthew R. Werner, CFA
mwerner@chiltoncapital.com
(713) 243- 3234
Bruce G. Garrison, CFA
bgarrison@chiltoncapital.com
(713) 243-3233
Thomas P. Murphy, CFA
tmurphy@chiltoncapital.com
(713) 243-3211
RMS: 2,614 (1.31.2024) vs. 2,727 (12.31.2023) vs. 2,398 (12.31.2022) vs. 3,177 (12.31.2021) vs 1,433 (3.23.2020) and 2,560 (2.21.2020)
An investment cannot be made directly in an index. The funds consist of securities which vary significantly from those in the benchmark indexes listed above and performance calculation methods may not be entirely comparable. Accordingly, comparing results shown to those of such indexes may be of limited use.)
The information contained herein should be considered to be current only as of the date indicated, and we do not undertake any obligation to update the information contained herein in light of later circumstances or events. This publication may contain forward looking statements and projections that are based on the current beliefs and assumptions of Chilton Capital Management and on information currently available that we believe to be reasonable, however, such statements necessarily involve risks, uncertainties and assumptions, and prospective investors may not put undue reliance on any of these statements. This communication is provided for informational purposes only and does not constitute an offer or a solicitation to buy, hold, or sell an interest in any Chilton investment or any other security. Past performance does not guarantee future results.
Information contained herein is derived from and based upon data licensed from one or more unaffiliated third parties, such as Bloomberg L.P. The data contained herein is not guaranteed as to its accuracy or completeness and no warranties are made with respect to results obtained from its use. While every effort is made to provide reports free from errors, they are derived from data received from one or more third parties and, as a result, complete accuracy cannot be guaranteed.
Index and ETF performances [MSCI and VNQ and FNER and LBUSTRUU] are presented as a benchmark for reference only and does not imply any portfolio will achieve similar returns, volatility or any characteristics similar to any actual portfolio. The composition of a benchmark index may not reflect the manner in which any is constructed in relation to expected or achieved returns, investment holdings, sectors, correlations, concentrations or tracking error targets, all of which are subject to change over time.
Leave a Reply Cancel reply
for more info on our strategy
go now →
for more info on our strategy
go now →
VIEW CHILTON'S LATEST
Media Features
go now →
Contact Us
READ THE LATEST
REIT Outlook
go now →
disclaimers
terms & conditions & FORM ADV
SITE CREDIT
Navigate
HOME
TEAM
REITS 101
Approach
OUTLOOKS
media
Contact
back to top
VISIT CHILTON CAPITAL MANAGEMENT
This property and any marketing on the property are provided by Chilton Capital Management, LLC and their affiliates (together, "Chilton"). Investment advisory services are provided by Chilton, an investment adviser registered with the SEC. Please be aware that registration with the SEC does not in any way constitute an endorsement by the SEC of an investment adviser’s skill or expertise. Further, registration does not imply or guarantee that a registered adviser has achieved a certain level of skill, competency, sophistication, expertise or training in providing advisory services to its advisory clients. Please consider your objectives before investing. A diversified portfolio does not ensure a profit or protect against a loss. Past performance does not guarantee future results. Investment outcomes, simulations, and projections are forward-looking statements and hypothetical in nature. Neither this website nor any of its contents shall constitute an offer, solicitation, or advice to buy or sell securities in any jurisdictions where Chilton is not registered. Any information provided prior to opening an advisory account is on the basis that it will not constitute investment advice and that we are not a fiduciary to any person by reason of providing such information. Any descriptions involving investment process, portfolio construction or characteristics, investment strategies, research methodology or analysis, statistical analysis, goals, risk management are preliminary, provided for illustration purposes only, and are not complete and will not apply in all situations. The content herein may be changed at any time in our discretion . Performance targets or objectives should not be relied upon as an indication of actual or projected future performance. Investment products and investments in securities are: NOT FDIC INSURED • NOT A DEPOSIT OR OTHER OBLIGATION OF,OR GUARANTEED BY A BANK • SUBJECT TO INVESTMENT RISKS, INCLUDING POSSIBLE LOSS OF THE PRINCIPAL AMOUNT INVESTED. Investing in securities involves risks, and there is always the potential of losing money when you invest in securities including possible loss of the principal amount invested. Before investing, consider your investment objectives and our fees and expenses. Our advisory services are designed to assist clients in achieving discrete financial goals. They are not intended to provide tax advice, nor financial planning with respect to every aspect of a client’s financial situation, and do not incorporate specific investments that clients hold elsewhere. Prospective and current clients should consult their own tax and legal advisers and financial planners. For more details, see links below to CRS (Part 3 of Form ADV) for natural person clients; Part 2A and 2B of Form ADV for all clients regarding important disclosures.