A Differentiated View Within Industrial REITs | March 2024
March 1, 2024
As a result of the normalization of e-commerce growth after the pandemic boom, there have been numerous headlines about retailers and logistics companies rationalizing their warehouse footprints, including from the 800 lb. gorilla, Amazon (NASDAQ: AMZN). However, these normalizations come off an exceptionally high base, and we believe the forward outlook for industrial is far more attractive than many investors appreciate, especially when looking beyond 2024.
Development starts fell off of a cliff in 2023 due to an increase in construction and financing costs, meaning deliveries will decline over the coming quarters (~18 month approval and construction period). Additionally, the rent growth in 2021-2022 produced a significant “lease mark-to-market” embedded in industrial REITs, which should lead to outsized NOI (net operating income) growth over the coming years. However, we do not expect NOI growth to immediately translate to the bottom line due to rising interest expense and other headwinds. For these reasons, we are slightly underweight to the industrial group overall, but have been “picking our spots” with meaningful overweight positions in specific industrial REITs where earnings multiples are more attractive relative to growth.
E-Commerce Trend
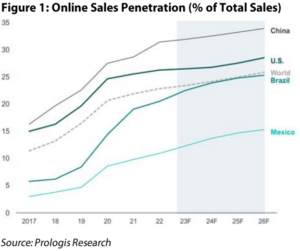
E-commerce has long been a growing trend impacting commercial real estate, but the pandemic generated an online shopping surge. Specifically, as highlighted in Figure 1, e-commerce penetration (online sales divided by total retail sales) in the U.S. jumped from the high teens to the mid 20’s between 2019 and 2020. As a general rule of thumb, online sales require roughly 3x the amount of logistics space as traditional brick and mortar sales. Therefore, the rapid surge in online shopping also led to a boom in demand for logistics space.
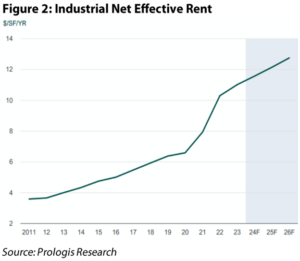
Detailed in Figure 2, industrial rents had been growing steadily since the financial crisis, but starting in 2020, growth accelerated to record levels. Nationwide, industrial rents increased 18% in 2021, followed by an even more impressive 26% in 2022 based on analysis from Green Street Advisors. In some of the hottest markets (e.g., Southern California), rents more than doubled over the same period. As a result of this growth (and fueled by near 0% interest rates), development activity also surged. Due to elevated supply as well as normalizing e-commerce growth, rent growth fell to “only” +5% in 2023, and is expected to approximate inflation in 2024 as the market works through the remaining glut of new supply (mostly first half 2024).
Mark-to-Market Upside
Industrial leases are typically between 5-7 years, meaning ~15% of a portfolio comes up for renewal each year. As such, leases coming due in 2024 were originally signed in 2017-2019 at rents well below today’s market. In particular, the market rent growth from 2021-22 produced an exceptionally large “lease mark-to-market” in existing portfolios. The real estate business uses the term “mark-to-market” to quantify how much a landlord could change the rent if he or she could bring the entire portfolio to market rates.
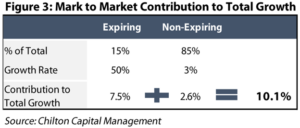
Depending on the market, today’s lease mark-to-market ranges from ~15% to nearly 60%. This means that even if market rent growth is 0%, landlords have several years of embedded growth waiting to be realized by bringing their rents to market. Figure 3 walks through a real world example. Rexford Industrial (NYSE: REXR), a 100% Southern California industrial REIT, had a lease mark-to-market over 50% as of 12/31/23. If we assume ~15% of the portfolio expires annually and the non-expiring portion of the portfolio has 3% annual escalators, cash revenue growth would be +10.1% per year without any change to market rent or occupancy.
Beyond the Headlines
Demand for industrial property is essentially a function of industrial production, GDP, and consumer spending, plus any changes to the supply chain and inventory levels. As we covered above, e-commerce growth has normalized since 2021; however, e-commerce sales are expected to grow +6.6% annually through 2028 compared to +2% for traditional retail sales. Given the 3x logistical space need for online sales, industrial demand should grow faster relative to GDP, a rare ‘secular growth’ story for REITs.
Amazon’s relevance to industrial real estate markets cannot be overstated, and the narrative around Amazon’s industrial footprint has had an impact industrial REIT prices. In 2020 and 2021, the warehouse giant opened over 200 million square feet of space across fulfillment centers, sortation stations, and delivery stations. Putting this number in perspective, Amazon accounted for nearly a third of nationwide net absorption in 2020. In 2022, the narrative shifted when Amazon (among others) announced plans to rationalize growth. Importantly, Amazon’s total leased space never declined; instead, the rate of positive growth simply moved lower. Looking forward through 2028, Amazon’s warehouse space is still expected to grow meaningfully quicker than pre-pandemic.
Another topic important to industrial demand is “on-“ or “near-shoring”, which is effectively the reversal of the “off-shoring” trend witnessed over the past few decades. As supply chain disruptions become more pronounced, manufacturers have been looking to move operations closer to the consumers they serve. While there is hope this could drive manufacturing growth domestically (“on-shoring”), thus far we have mostly seen this trend materialize through manufacturing growth in Mexico (“near-shoring”). In addition, retailers that have been burned by the ‘just-in-time’ inventory trend of the early 2000’s, which has increased the need for retailers to store extra inventory near customers.
Supply Cliff Coming
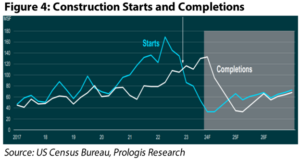
Given the bullish rental increases outlined above, as well as a near 0% interest rate environment, it should not be surprising that industrial development activity also went gangbusters in 2021. Shown in Figure 4 below, development starts (blue line) grew rapidly during 2021, peaking in the first quarter of 2022 at roughly 170 million square feet. Given the typical approval and construction timeline between ~1-2 years, most these projects are delivering between 2H2023 and 1H2024.
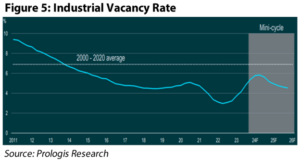
The combined pullback in demand growth amidst record supply additions has caused an increase in the vacancy rate (the amount of space not currently occupied), as one would expect. However, this increase was off an exceptionally tight base, as the ~3% vacancy rate from mid-2023 was unsustainable. Highlighted in Figure 5, vacancy reached roughly 5% at the end of 2023, and projections suggest a peak below 6% sometime in late 2024. In normal times, 7% is considered a mid-cycle vacancy rate, meaning the industrial balance remains “tight” by historical standards (e.g., favoring the landlord).
Looking out slightly further, the remaining supply “glut” should come online over the next several quarters, after which industrial space additions should be minimal. According to Green Street Advisors, only 2% of existing supply is expected to be completed in 2025, which barely offsets obsolescence levels. Moreover, construction and financings costs remain elevated, giving us confidence that starts are not going to reaccelerate any time soon, even if there is an increase in rents.
Southern California Spotlight
Not only is Southern California (and specifically Los Angeles) the largest industrial market in the country (representing a 25% market share worth roughly half a trillion), it also experienced the largest increase in market rents. After this rapid increase, the Twin Ports of Los Angeles and Long Beach (which our team had the opportunity to tour in November) endured a major labor negotiation, putting these sky-high rents under pressure. With a labor agreement finalized, port volumes entering Southern California have regained share against the Gulf of Mexico and East Coast ports. Most recently, safety issues around the Suez and drought conditions in Panama have further solidified Southern California’s position. We believe Southern California exemplifies the attributes we find attractive in our nationwide outlook with strong demand and barriers to new entrants. As such, we’ve been increasing our position in Rexford, a 100% focused Southern California industrial REIT.
Outsized Earnings Growth
Industrial REITs are currently afforded a two-pronged pathway to outsized earnings growth. First, simply realizing their existing mark-to-market could generate double digit growth for several years. More importantly, the supply/demand balance is positioned to inflect meaningfully next year, potentially adding mid-single digit market rent growth on top of the mark-to-market potential.
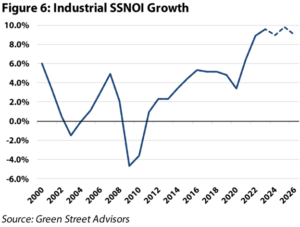
Historically, shown in Figure 6 below, industrial REITs have grown same store net operating income (SSNOI) by roughly 3%. Over the past two years, the group has grown SSNOI annually by over 9%, and based on our estimates, we anticipate nearly +10% growth per annum for the next three years. However, we do not expect operational growth to translate directly to earnings growth equally for all industrial REITs. Notably, interest expense and ancillary business (e.g., development and management platforms) headwinds weigh on funds from operations (FFO) growth even while underlying NOI growth is expected to be record-breaking.
Valuation
As of February 29, 2024, industrial REITs were trading at ~24x 2024 FFO estimates, which compares to 18x for the market cap weighted average of all REITs. Since 2010, the group has traded at an average FFO multiple of ~22x, peaking at 35x FFO in late 2021. If we look at growth to justify the current multiple, although NOI growth looks exceptionally strong, FFO/AFFO growth does not stand out nearly as much relative to the 2010-2020 period. Recall, earnings growth over the past decade benefited from a nearly constant tailwind of declining interest rates (and therefore interest expense).
After industrial REITs saw earnings decimated in the financial crisis, the surviving group increased FFO per share over 9% per annum through 2020. In 2024, due largely to the headwind from higher interest expense, we expect average industrial REIT FFO growth of +5.4% (note we normalize PLD’s FFO to exclude promote income), which compares to the REIT average of +2.9%.
As the interest expense headwind abates in 2025, we expect FFO per share growth to improve to +10.7%. Although industrial REITs should exceed the average REIT growth rate, these figures are not exceptionally attractive relative to the premium multiple. Therefore, we maintain a modest underweight to the industrial REITs overall, and have instead focused on specific names we believe to be undervalued relative to their growth prospects.
For example, REXR sports arguably the strongest growth outlook in industrial (management highlighted 14-17% annual growth in 2025/26 on their latest earnings call), but is trading below the peer average multiple. In our view, REXR has been overly penalized due to its concentration in Southern California, and as fundamentals in that market inflect, we expect the REXR’s multiple to better reflect its growth potential. Additionally, outside of the traditional industrial REITs, we have looked to some more niche corners of the group for higher growth at lower multiples – notably Americold (NYSE: COLD) the largest publicly traded cold storage REIT.
Conclusion
Industrial fundamentals cooled in 2023, but this oversimplification fails to highlight that current growth remains above the long term average. Case in point, vacancy rates for industrial properties barely ticked above 5% this year, which historically is considered to be a tight market (e.g., favoring the landlord). Importantly, new industrial development deliveries are expected to plummet by the end of 2024.
Overall, the strong fundamentals make this sector make this sector attractive. However, our focus on valuation and performance above the benchmark has led us to underweight the largest industrial REIT, Prologis (NYSE: PLD). PLD has a market cap over $122 billion, larger than all other industrial REITs combined. Though the company will do well given the strong fundamentals, we believe there is an opportunity for other industrial REITs to ‘catch-up’ to PLD’s valuation, and potentially exceed it.
Thomas P. Murphy, CFA
tmurphy@chiltoncapital.com
(713) 243-3211
Matthew R. Werner, CFA
mwerner@chiltoncapital.com
(713) 243- 3234
Bruce G. Garrison, CFA
bgarrison@chiltoncapital.com
(713) 243-3233
Isaac A. Shrand, CFA
ishrand@chiltoncapital.com
(713) 243-3219
RMS: 2,667 (2.29.2024) vs. 2,727 (12.31.2023) vs. 2,398 (12.31.2022) vs. 3,177 (12.31.2021) vs 1,433 (3.23.2020) and 2,560 (2.21.2020)
An investment cannot be made directly in an index. The funds consist of securities which vary significantly from those in the benchmark indexes listed above and performance calculation methods may not be entirely comparable. Accordingly, comparing results shown to those of such indexes may be of limited use.)
The information contained herein should be considered to be current only as of the date indicated, and we do not undertake any obligation to update the information contained herein in light of later circumstances or events. This publication may contain forward looking statements and projections that are based on the current beliefs and assumptions of Chilton Capital Management and on information currently available that we believe to be reasonable, however, such statements necessarily involve risks, uncertainties and assumptions, and prospective investors may not put undue reliance on any of these statements. This communication is provided for informational purposes only and does not constitute an offer or a solicitation to buy, hold, or sell an interest in any Chilton investment or any other security. Past performance does not guarantee future results.
Information contained herein is derived from and based upon data licensed from one or more unaffiliated third parties, such as Bloomberg L.P. The data contained herein is not guaranteed as to its accuracy or completeness and no warranties are made with respect to results obtained from its use. While every effort is made to provide reports free from errors, they are derived from data received from one or more third parties and, as a result, complete accuracy cannot be guaranteed.
Index and ETF performances [MSCI and VNQ and FNER and LBUSTRUU] are presented as a benchmark for reference only and does not imply any portfolio will achieve similar returns, volatility or any characteristics similar to any actual portfolio. The composition of a benchmark index may not reflect the manner in which any is constructed in relation to expected or achieved returns, investment holdings, sectors, correlations, concentrations or tracking error targets, all of which are subject to change over time.
Leave a Reply Cancel reply
for more info on our strategy
go now →
for more info on our strategy
go now →
VIEW CHILTON'S LATEST
Media Features
go now →
Contact Us
READ THE LATEST
REIT Outlook
go now →
disclaimers
terms & conditions & FORM ADV
SITE CREDIT
Navigate
HOME
TEAM
REITS 101
Approach
OUTLOOKS
media
Contact
back to top
VISIT CHILTON CAPITAL MANAGEMENT
This property and any marketing on the property are provided by Chilton Capital Management, LLC and their affiliates (together, "Chilton"). Investment advisory services are provided by Chilton, an investment adviser registered with the SEC. Please be aware that registration with the SEC does not in any way constitute an endorsement by the SEC of an investment adviser’s skill or expertise. Further, registration does not imply or guarantee that a registered adviser has achieved a certain level of skill, competency, sophistication, expertise or training in providing advisory services to its advisory clients. Please consider your objectives before investing. A diversified portfolio does not ensure a profit or protect against a loss. Past performance does not guarantee future results. Investment outcomes, simulations, and projections are forward-looking statements and hypothetical in nature. Neither this website nor any of its contents shall constitute an offer, solicitation, or advice to buy or sell securities in any jurisdictions where Chilton is not registered. Any information provided prior to opening an advisory account is on the basis that it will not constitute investment advice and that we are not a fiduciary to any person by reason of providing such information. Any descriptions involving investment process, portfolio construction or characteristics, investment strategies, research methodology or analysis, statistical analysis, goals, risk management are preliminary, provided for illustration purposes only, and are not complete and will not apply in all situations. The content herein may be changed at any time in our discretion . Performance targets or objectives should not be relied upon as an indication of actual or projected future performance. Investment products and investments in securities are: NOT FDIC INSURED • NOT A DEPOSIT OR OTHER OBLIGATION OF,OR GUARANTEED BY A BANK • SUBJECT TO INVESTMENT RISKS, INCLUDING POSSIBLE LOSS OF THE PRINCIPAL AMOUNT INVESTED. Investing in securities involves risks, and there is always the potential of losing money when you invest in securities including possible loss of the principal amount invested. Before investing, consider your investment objectives and our fees and expenses. Our advisory services are designed to assist clients in achieving discrete financial goals. They are not intended to provide tax advice, nor financial planning with respect to every aspect of a client’s financial situation, and do not incorporate specific investments that clients hold elsewhere. Prospective and current clients should consult their own tax and legal advisers and financial planners. For more details, see links below to CRS (Part 3 of Form ADV) for natural person clients; Part 2A and 2B of Form ADV for all clients regarding important disclosures.