Assessing the Impact of Mortgage Rates on REITs | October 2024
October 1, 2024
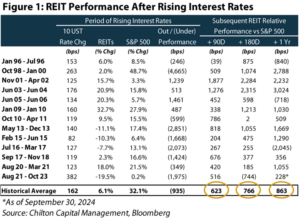
Historically, following periods of rising interest rates, REITs have outperformed the S&P 500 over the subsequent 90-, 180-, and 365-day periods as shown in Figure 1 below. We discussed this phenomenon in great detail in our May 2024 REIT Outlook titled An Interesting Time to Invest in REITs. From its May 1st release through September 30, 2024, REITs have generated a total return of +25.0%, as measured by the MSCI U.S. REIT Index (Bloomberg: RMZ), outperforming the S&P 500 by roughly 1,000-basis points (“bps”) over the same period.
Mortgage rates, while related to interest rates, affect REITs differently, particularly within the self-storage and residential sectors. While general interest rates guide economic activity and capital flows, mortgage rates dictate the cost of homeownership, directly impacting rental demand for multifamily and single-family rental (“SFR”) REITs and home sales / moving activity which affects demand for self-storage REITs. However, the extent to which rental demand is affected remains frequently misconstrued.
The recent 50 bps rate cut from the Federal Open Market Committee (the “Fed”) has led many individuals to believe that mortgage rates will continue to ease. However, mortgage rates closely track the yield on the U.S. Treasury (“UST”) 10-year bond, which we believe already reflects the anticipated effects of future cuts / falling interest rates. For instance, following the Fed’s recent rate cut, the yield on the UST 10-year actually ticked slightly upwards, defying the downward nudge from the central bank.
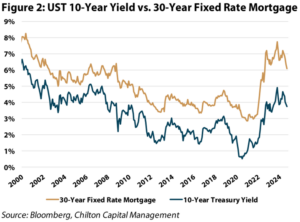
Over the past few years, mortgage rates have experienced rapid fluctuations – from historic lows during the pandemic to sharp rises in 2022-2023. Today, rates remain elevated relative to 2021, but have declined from a high of 7.8%. As we examine the current trends, Chilton’s positioning – an overweight to single-family rentals, strategic exposure to Coastal and Sun Belt multifamily, and a “wait-and-see” approach in self-storage – remains well-suited to benefit in what is likely to be a declining, albeit gradual, mortgage rate environment ahead, as we will explain.
The UST 10-Year and Mortgage Rates
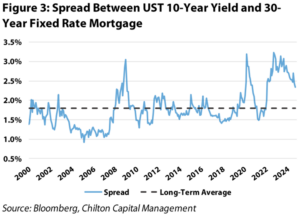
To fully appreciate how today’s mortgage rates can influence REIT performance, it’s essential to examine their long-term relationship with the UST 10-year yield. Historically, mortgage rates have closely tracked the UST 10-year as seen in Figure 2. However, the spread between the two widened significantly during the inflationary surge of 2022-2023. While mortgage rates historically have averaged ~180 bps above the UST 10-year, volatility caused the spread to extend beyond 300 bps from late 2022 through 2023.
As the spread has since compressed to around 230 bps today, another ~50 bps of compression remains on the table for the 30-year mortgage rate to revert to its long-term average spread as presented in Figure 3. Therefore, amid further rate cuts, if the UST 10-year holds steady around 3.75%, mortgage rates could trend down into the mid-5s even.
Mortgage Rates and Home Affordability
Lower mortgage rates certainly appear appealing on the surface for potential homebuyers, translating into more affordable monthly payments and increased buying power. However, the allure of lower rates could also introduce its own set of complications. If mortgage rates decline even further, it is likely to attract more buyers to the market. This increased demand could lead to heightened competition for available properties, potentially driving up home prices and offsetting the benefits of lower rates.
Alongside the potential increase in home prices is the predominant barrier to homebuying – the down payment. With the median sales price of existing homes reaching $417,000 in August 2024, prospective homebuyers would need to save approximately $83,000 to put down the traditional 20% of purchase price. Although one political candidate for President proposes a $25,000 cash advance for first-time homebuyers to assist with down payments, this could lead to an immediate rise in home prices, diminishing much of the intended benefit.
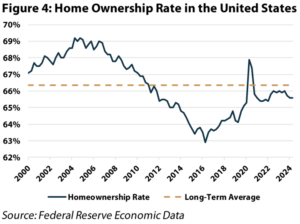
Moreover, the median existing-home price has risen by 32% in the past four years alone – one of the most notable increases in the past half century. As a result, the nationwide home ownership rate has declined to 65.6%, slightly below its long-term average, as shown in Figure 4.
The “Lock-In Effect”
As of September 30, 2024, the 30-year mortgage rate hovers around 6.1%, down considerably from its 2023 peak of 7.8% and 70 bps below the 6.8% rate present a mere two months ago. While this represents a significant improvement, it remains well above recent norms seen in the 2010s when rates were as low as 3-4%.
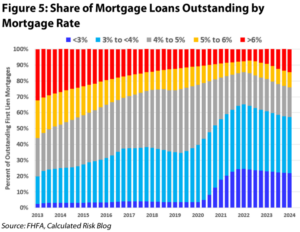
Furthermore, over 85% of existing mortgages have rates below 6% (Figure 5), creating a “lock-in effect” that has curtailed home sales to lows not seen since the global financial crisis (“GFC”). Simply put, homeowners remain reluctant to give up their lower-rate mortgages, resulting in stifled mobility in the housing market – a trend we first explored in our February 2024 REIT Outlook.
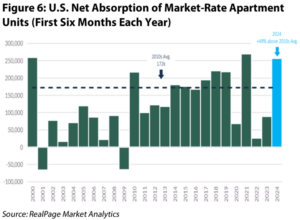
This lock-in effect is a double-edged sword. For self-storage REITs, fewer home sales reduce the need for temporary storage. While demand for the sector is driven by the “Five D’s” (downsizing, divorce, death, dislocation, and decluttering), home sales, or dislocation, remains the dominant factor. Conversely, for multifamily and SFR REITs, the constrained supply of homes for sale boosts rental demand. When homeowners stay put, prospective buyers are pushed to the rental market, allowing multifamily and SFR properties to absorb the excess demand. This trend is supported by declining home ownership rates, leading to more renters, as discussed earlier. This dynamic has been a driving force behind the net absorption of market-rate apartment units producing their second strongest start to any year on record, as shown in Figure 6.
Residential REITs: Affordability and Supply
One of the most common misconceptions is that falling mortgage rates will lead to a massive decline in rental demand. While it’s true that lower mortgage rates make buying a home more affordable, the affordability gap between renting and owning remains substantial.
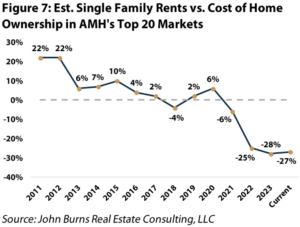
For example, in markets where American Homes 4 Rent (NYSE: AMH) operates, renting a single-family home is roughly 27% cheaper than buying, as shown in Figure 7, equating to savings of ~$900 per month. Even with a significant drop in mortgage rates, these affordability gaps are unlikely to close any time soon, creating a strong foundation for continued rental demand and sizeable future rent increases, particularly for SFR and multifamily REITs. To underscore the disparity, mortgage rates would need to drop to 3.5% for monthly homeownership costs (including taxes, insurance, and a 20% down payment on a $417,000 home) to align with current single-family rents.
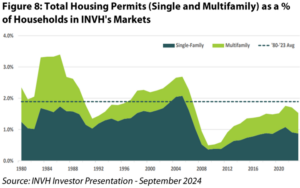
Additionally, the U.S. is facing a prolonged housing supply shortage, further reinforcing demand for rental properties. The country is undersupplied by an estimated 4.5 million homes, according to analysis by Zillow, and housing permits as a percentage of households remain well below the 43-year average of 1.9%. This is insufficient to meet demand, especially for single-family homes, as presented in Figure 8.
In 2023, however, around 1.45 million homes were completed, marking the strongest year for construction since the early stages of the GFC, according to U.S. Census Bureau data. Nevertheless, with 1.8 million new U.S. households formed last year, homebuilding fell short once again, further widening the nationwide housing shortage. Relatedly, multifamily starts are down 40% year-over-year, bringing them to their lowest level in over 10 years and setting up a favorable environment for multifamily REITs in 2026-2027.
Implications for Rent Growth
Despite concerns about rising rents, rent-to-income ratios across residential REITs remain below their historical averages. For further context, wage growth has held strong, with a year-over-year change of +4.6% in August 2024, now outpacing rent growth for an impressive 22 consecutive months and supporting the case for further rent increases in the coming years.
When considering the sources of current and near-term rent growth, renewals stand out as a key driver, especially for multifamily REITs. Given that each of the six largest multifamily REITs effectively reported the lowest move-outs to buy a home in company history on their recent earnings calls, resident turnover now resides near all-time lows (~46%), stabilizing occupancy and allowing the REITs to raise rents (renewals) on individuals who have been and will likely continue to “stay put” until housing affordability improves more meaningfully.
Self Storage REITs and Home Sale Activity
For self-storage REITs, home sale activity remains a pivotal driver of demand. As mortgage rates fall, home sales are expected to increase, ultimately boosting demand for self-storage as homeowners transition between properties. Historically, self-storage move-in rent growth has been strongly correlated with home sales activity, with demand surging during the pandemic housing boom, lifting move-in rents by 50% y/y, as illustrated in Figure 9.
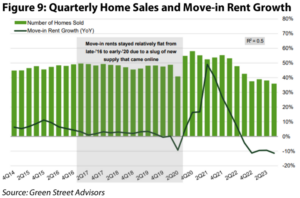
Although move-in rent growth has declined year-over-year due to sluggish home sales, existing customer rent increases (“ECRIs”) remain positive, frequent, and significant – averaging +20% after just four months of occupancy. Additionally, unavoidable life events such as divorce or death will eventually overcome the “lock-in effect” in-place. We believe this trend will lead to positive same-store revenue growth by 2025, supported by easier comparisons and increased home sales activity. Chilton’s positioning within the self-storage space aligns with market expectations, awaiting an opportune moment when fundamentals inflect and clearer visibility emerges.
Conclusion
Mortgage rates continue to play a critical role in the performance of self-storage, multifamily, and SFR REITs. If mortgage rates were to decline further from today’s 6.1%, we expect both SFR and multifamily REITs to continue to benefit from strong rental demand, a prolonged housing supply shortage, and accretive external growth due to a favorable cost of capital. However, the affordability gap between renting and owning may begin to narrow. In contrast, self-storage REITs are likely to see demand rise as home sales recover, which we plan to closely monitor over the next 6-9 months. But until present, other demand factors such as death, divorce, and downsizing remain inevitable, buoying the sector’s demand in the interim.
If the yield on the UST 10-year continues to decline, mortgage rates could drop more than anticipated. As a result, this would concurrently lower capital costs for REITs, bringing about several potential benefits. A decrease in rates would lower debt service payments for floating rate exposure, enable refinancing at more favorable terms, improve cash flow, and potentially drive higher valuations through cap rate compression and multiple expansion. Multifamily REITs such as AvalonBay (NYSE: AVB) and Camden Property Trust (NYSE: CPT) are particularly well-positioned to capitalize on lower rates given their strong balance sheets, low leverage, and top-tier development platforms, resulting in both sizable and accretive external growth in the coming years.
Isaac A. Shrand, CFA
ishrand@chiltoncapital.com
(713) 243-3219
Matthew R. Werner, CFA
mwerner@chiltoncapital.com
(713) 243- 3234
Bruce G. Garrison, CFA
bgarrison@chiltoncapital.com
(713) 243-3233
Thomas P. Murphy, CFA
tmurphy@chiltoncapital.com
(713) 243-3211
RMS: 3,159 (9.30.2024) vs. 2,727 (12.31.2023) vs. 3,177 (12.31.2021) vs. 1,433 (3.23.2020)
An investment cannot be made directly in an index. The funds consist of securities which vary significantly from those in the benchmark indexes listed above and performance calculation methods may not be entirely comparable. Accordingly, comparing results shown to those of such indexes may be of limited use.)
The information contained herein should be considered to be current only as of the date indicated, and we do not undertake any obligation to update the information contained herein in light of later circumstances or events. This publication may contain forward looking statements and projections that are based on the current beliefs and assumptions of Chilton Capital Management and on information currently available that we believe to be reasonable, however, such statements necessarily involve risks, uncertainties and assumptions, and prospective investors may not put undue reliance on any of these statements. This communication is provided for informational purposes only and does not constitute an offer or a solicitation to buy, hold, or sell an interest in any Chilton investment or any other security. Past performance does not guarantee future results.
Information contained herein is derived from and based upon data licensed from one or more unaffiliated third parties, such as Bloomberg L.P. The data contained herein is not guaranteed as to its accuracy or completeness and no warranties are made with respect to results obtained from its use. While every effort is made to provide reports free from errors, they are derived from data received from one or more third parties and, as a result, complete accuracy cannot be guaranteed.
Index and ETF performances [MSCI and VNQ and FNER and LBUSTRUU] are presented as a benchmark for reference only and does not imply any portfolio will achieve similar returns, volatility or any characteristics similar to any actual portfolio. The composition of a benchmark index may not reflect the manner in which any is constructed in relation to expected or achieved returns, investment holdings, sectors, correlations, concentrations or tracking error targets, all of which are subject to change over time.
Leave a Reply Cancel reply
for more info on our strategy
go now →
for more info on our strategy
go now →
VIEW CHILTON'S LATEST
Media Features
go now →
Contact Us
READ THE LATEST
REIT Outlook
go now →
disclaimers
terms & conditions & FORM ADV
SITE CREDIT
Navigate
HOME
TEAM
REITS 101
Approach
OUTLOOKS
media
Contact
back to top
VISIT CHILTON CAPITAL MANAGEMENT
This property and any marketing on the property are provided by Chilton Capital Management, LLC and their affiliates (together, "Chilton"). Investment advisory services are provided by Chilton, an investment adviser registered with the SEC. Please be aware that registration with the SEC does not in any way constitute an endorsement by the SEC of an investment adviser’s skill or expertise. Further, registration does not imply or guarantee that a registered adviser has achieved a certain level of skill, competency, sophistication, expertise or training in providing advisory services to its advisory clients. Please consider your objectives before investing. A diversified portfolio does not ensure a profit or protect against a loss. Past performance does not guarantee future results. Investment outcomes, simulations, and projections are forward-looking statements and hypothetical in nature. Neither this website nor any of its contents shall constitute an offer, solicitation, or advice to buy or sell securities in any jurisdictions where Chilton is not registered. Any information provided prior to opening an advisory account is on the basis that it will not constitute investment advice and that we are not a fiduciary to any person by reason of providing such information. Any descriptions involving investment process, portfolio construction or characteristics, investment strategies, research methodology or analysis, statistical analysis, goals, risk management are preliminary, provided for illustration purposes only, and are not complete and will not apply in all situations. The content herein may be changed at any time in our discretion . Performance targets or objectives should not be relied upon as an indication of actual or projected future performance. Investment products and investments in securities are: NOT FDIC INSURED • NOT A DEPOSIT OR OTHER OBLIGATION OF,OR GUARANTEED BY A BANK • SUBJECT TO INVESTMENT RISKS, INCLUDING POSSIBLE LOSS OF THE PRINCIPAL AMOUNT INVESTED. Investing in securities involves risks, and there is always the potential of losing money when you invest in securities including possible loss of the principal amount invested. Before investing, consider your investment objectives and our fees and expenses. Our advisory services are designed to assist clients in achieving discrete financial goals. They are not intended to provide tax advice, nor financial planning with respect to every aspect of a client’s financial situation, and do not incorporate specific investments that clients hold elsewhere. Prospective and current clients should consult their own tax and legal advisers and financial planners. For more details, see links below to CRS (Part 3 of Form ADV) for natural person clients; Part 2A and 2B of Form ADV for all clients regarding important disclosures.