MOBs: Office but No Need for Life Support | November 2024
November 1, 2024
No area of real estate has been under more pressure than the office sector. We won’t belabor the headwinds – flexible work, tech downsizing, debt maturities, etc. – in today’s report, but there is a niche section of office space benefiting from robust demand drivers. Historically, we referred to this group as Medical Office Buildings (MOBs); however, the higher quality end of the group has rebranded to Medical Outpatient Buildings (also MOBs) and we think the distinction is important. We break down the specifics further in this report, but there are three high level factors driving the investment case for MOBs: 1) unlike in traditional office, healthcare requires in-office interactions which reduces the risk of ‘work from home’, 2) outpatient services are taking market share from inpatient (hospital) settings due to better costs and, in some cases, outcomes, and 3) the rapidly aging U.S. population.
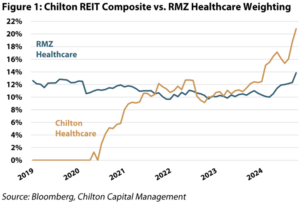
Point number three has implications across all of healthcare, so it should not come as a surprise we have added exposure to healthcare REITs, representing one of our composite’s biggest overweights at 20.8% versus our benchmark, the MSCI US REIT Index (RMZ), at 13.9% as of October 31, 2024 (Figure 1). This wasn’t always the case, as we had zero healthcare exposure going into the pandemic and only modest positions beginning in mid-2020. Initially, our primary focus was Senior Housing (SH) REITs (our September 2023 Outlook on the topic) where we saw the biggest opportunity for earnings to “snap back” from COVID’s demand disruption. Our SH thesis continues to play out, but has already generated impressive outperformance. However, more recently, we have trimmed healthcare winners to redeploy into MOBs – a strategy starting to bear fruit but that we believe has more room to run.
Work From Home
A major distinction of traditional office versus healthcare office is the ability to work from home. While we did see an increased emphasis on telehealth services during the pandemic, by and large, healthcare requires patients and workers to physically enter the office. Indeed, a 2021 survey from American Community showed that only 10% of healthcare employees primarily worked from home, and the in-office requirement only increases for higher acuity patients. Conversely, based on data from Gallup, some professions exceeded 80% work from home during 2021. Overall, the risk from telehealth and work from home is minimal for high quality and well-located MOB product.
Investing in MOBs
Based on the portfolios of the underlying companies, our composites weighted average MOB exposure was 6.5% as of October 31, 2024, which is double the exposure of the RMZ. As Figure 2 highlights, we achieve our MOB exposure through investments in: American Healthcare REIT (NYSE: AHR), Ventas Inc (NYSE: VTR), Welltower Inc (NYSE: WELL), Healthcare Realty (NYSE: HR), and Sila Realty (NYSE: SILA).
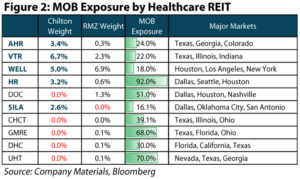
Within our MOB positions, it is important to distinguish multi- and single-tenant buildings, as well as triple net and gross leases. Under a triple net lease, the tenant is responsible for real estate taxes, maintenance and insurance, while, in a gross lease the landlord is responsible. Triple net buildings are popular with investors due to less operational intensity and the lack of recurring capex; however, the vacancy risk from a single tenant is more pronounced. In our view, both types of buildings possess attractive investment cases. Well-located, multi-tenant buildings should benefit from the expenditure shift between inpatient and outpatient facilities, and we primarily achieve exposure to this group through HR, WELL, and VTR. Conversely, triple net, single tenant buildings likely experience less earnings growth in the coming years; but, given the higher cap rates on acquisitions, we believe the REITs can use attractive costs of capital to accretively grow. We benefit from this exposure through our most recent investments in SILA and AHR.
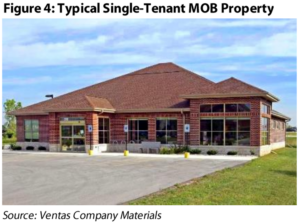
For visualization purposes, Figure 3 shows a standard multi-tenant MOB. Typically, these facilities are located near major medical campuses and house numerous specialties under one roof. On the other end, Figure 4 shows a typical single tenant building. As the name implies, these assets are leased to a single user (typically under a triple net lease) and are typically located outside of major medical campuses.

Aging: Overarching Demand Driver
Before diving into specific considerations for MOBs, we should discuss the 80-year-old gorilla in the room – America is old and aging rapidly. Indeed, the youngest Baby Boomers turned 60 this year, so it should not come as a surprise that the 65+ and 80+ cohorts are both projected to have outsized population growth in the coming years. Based on forecasts from the U.S. Census Bureau, the share of the population over 65 is expected to increase from 15% today to 20% in 2030 (and to 25% in 2060). Furthermore, the 65+ cohort spends meaningfully more on healthcare than younger age groups. Combining these two factors, most experts anticipate healthcare spending to materially outpace GDP for at least the next decade. Though rapid growth bolsters all aspects of healthcare real estate, we believe MOBs are positioned particularly well to benefit from this tremendous fundamental tailwind.
In vs. Out Patient
The first important distinction to understand for MOBs is outpatient versus inpatient, which, generally speaking, is simply whether or not the patient stays “in” a facility overnight. Inpatient comprises the highest acuity patients and procedures, but the overall trend in healthcare continues to push more procedures into outpatient environments. Figure 5 highlights the bifurcation of inpatient and outpatient visits since 2000.
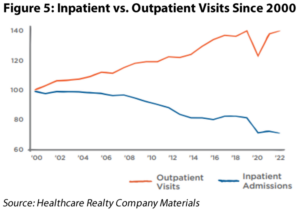
This trend’s driver is twofold; first, the cost to both the provider and the patient is substantially lower. Second, research also suggests patient outcomes are improved due to less hesitation to return to an outpatient facility (relative to the fear of going back to the hospital). Forecasts from the Advisory Board suggest a third of hospital revenues are in the process of transitioning to outpatient settings. From a volume perspective, over the next five years inpatient procedures are actually expected to decline by 0.7% while outpatient procedure volumes are expected to grow 10%.
Proximity and Clustering
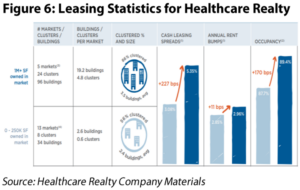
The second qualifier is proximity to a major medical campus (e.g., distance), along with the amount of related healthcare facilities clustered in the immediate vicinity (e.g., density). Health systems – which are simply healthcare organizations consisting of at least one hospital plus a group of physicians – desire proximity to easily facilitate the movement of patients and doctors. While there are many systems around the country, readers would likely recognize some of the largest, such as HCA Healthcare (NYSE: HCA), CommonSpirit Health, and Ascension Health. These systems also strive to cluster their facilities close together because of the benefit of staying “in-network”. A campus is centered around a hospital(s), but typically includes additional inpatient and outpatient facilities in the immediate vicinity. Clustering means a patient could travel to the medical center and schedule numerous appointments for one single day. From the landlord’s perspective, clustering buildings in a given market provides operational efficiencies and negotiating scale in leasing. Healthcare Realty (NYSE: HR) shared an illuminating exercise in their latest presentation (see Figure 6), showing leasing statistics for markets they own over 1 million sqft versus markets with less than 250,000 sqft. Most importantly, in markets with scale, HR achieved 170 basis points (bps) uplift in occupancy and a 227-bps benefit to leasing spreads.
Specialty Exposure
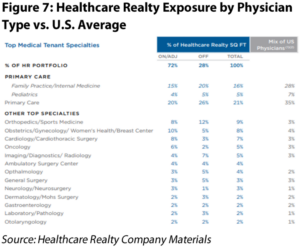
The end result from well-located and high-quality facilities is exposure to the most attractive tenant types (e.g., specialty). Generally, the higher acuity a practice serves, the more specialization required within their physical office space. More specialization tends to require expensive buildouts and equipment, and thus are much more difficult to move. As an example, imaging and radiology practices requires heavy machinery and “vaults” to provide a safe environment. Conversely, a primary care buildout is relatively simple and presents more risk a tenant can move down the street for a better deal. On top of the cost considerations, proximity is very difficult to recreate given supply constraints in major medical centers. Therefore, while primary care doctors can even operate out of retail strip centers or traditional office buildings, higher acuity specializations have less flexibility for location, lending to better renewal rates. HR’s exposure by physician type compared to the broader U.S. average (as well as HR’s exposure between on/adjacent and off campus) is highlighted in Figure 7. Importantly, primary care doctors make up 35% of U.S. physicians but only 21% of HR’s tenant base. Conversely, oncology represents 3% of the broader doctor pool but is 5% of HR’s tenant base.
Supply on Life Support
On top of the land constraint in major medical centers, healthcare real estate spending largely shut down at the start of the pandemic as developers were cautious to allocate capital. Today, even as fundamentals look attractive, higher construction and financing costs have maintained a lid on new development activity. Based on current costs, replacement costs in most markets are well above in-place values. Specifically, our model calculates HR trading at a per square foot real estate value of ~$290 as of September 30, 2024, while estimated construction costs today stand at $445/sqft based on Building Design + Construction. This certainly varies by market, but broadly speaking, rents need to rise meaningfully in order to incentivize new construction. As a result, current MOB developments only account for 2.2% of existing supply nationwide (down from 3.1% in 2Q23).
Higher Retention Driving Business
With robust demand and anemic supply, the ability to push rents while still retaining existing tenants tends to increase implicitly. This trend is already emerging with 2024 retention tracking meaningfully stronger than 2023 across the MOB REITs. We are also seeing the landlord’s power show up in stronger rental increases. Historically, MOBs grew in-line with inflation, but more recently growth has accelerated to a new normal. Not only have starting rental rates increased for new leases, but MOB landlords are striking annual escalators between +3-4% vs only +2-3% historically. Additionally, stronger retention also leads to less downtime between tenants and less cash outlays from the landlord (on broker commissions and leasing incentives). Taking all these considerations into account drives a meaningful step up in the cash flow growth profile of well positioned MOB REITs.
Rent Coverage = Ability to Push Rent
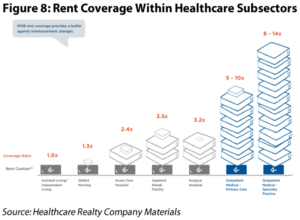
Another important metric we use to screen a landlord’s ability to push rent is rent coverage of their tenants. Rent coverage simply equates to a tenants’ cash flow divided by their rent. As shown in Figure 8 below, rent coverage within healthcare subsectors span from only 1x in the still impacted assisted living space to over 10x for specialized outpatient buildings. Specialty practices tend to be much higher margin operations that, all else equal, are much less sensitive to rental increases than other parts of healthcare.
Return of Private Capital
Public REITs are certainly not the only investors excited about the demographic trends supporting healthcare real estate in the coming decades, but we do believe they are the best positioned. Over the past few quarters, private capital came back into MOBs in a meaningful way. A sizable chunk of this activity has come through dispositions out of REITs. As an example, HR has generated $875 million of proceeds thus far in 2024 (as of 3Q24) at a weighted average cap rate of 6.6%. It may appear counter-intuitive to sell properties as fundamentals are inflecting positively; however, HR (through share buybacks, debt repurchases, and funding capital improvements) has been able to accretively redeploy these proceeds and create value for shareholders. Another sizable chunk has come through joint ventures between private capital and public REIT operators. To continue our HR example, the company announced JVs with both Nuveen and KKR this year and anticipates leveraging the platforms for long term growth (HR retained 20% ownership and earns both acquisition and management fees).
Conclusion
Medical Outpatient Buildings’ attractive offering of specialized office space for medical professionals presents a compelling option for REIT investors to benefit from America’s rapidly aging population. Not only are high quality MOBs benefiting from strong demand drivers, but the increase in construction/financing costs have limited supply growth creating a perfect scenario for rent increases in the future. We expect this combination of factors to drive strong earnings growth in well positioned MOB REITs over the coming years. Additionally, despite lower earnings growth we also see potential outperformance in the more ratable single-tenant end of the business due to attractive acquisition spreads.
Thomas P. Murphy, CFA
tmurphy@chiltoncapital.com
(713) 243-3211
Matthew R. Werner, CFA
mwerner@chiltoncapital.com
(713) 243- 3234
Bruce G. Garrison, CFA
bgarrison@chiltoncapital.com
(713) 243-3233
Isaac A. Shrand, CFA
ishrand@chiltoncapital.com
(713) 243-3219
RMS: 3,068 (10.31.2024) vs. 2,727 (12.31.2023) vs. 3,177 (12.31.2021) vs. 1,433 (3.23.2020)
An investment cannot be made directly in an index. The funds consist of securities which vary significantly from those in the benchmark indexes listed above and performance calculation methods may not be entirely comparable. Accordingly, comparing results shown to those of such indexes may be of limited use.)
The information contained herein should be considered to be current only as of the date indicated, and we do not undertake any obligation to update the information contained herein in light of later circumstances or events. This publication may contain forward looking statements and projections that are based on the current beliefs and assumptions of Chilton Capital Management and on information currently available that we believe to be reasonable, however, such statements necessarily involve risks, uncertainties and assumptions, and prospective investors may not put undue reliance on any of these statements. This communication is provided for informational purposes only and does not constitute an offer or a solicitation to buy, hold, or sell an interest in any Chilton investment or any other security. Past performance does not guarantee future results.
Information contained herein is derived from and based upon data licensed from one or more unaffiliated third parties, such as Bloomberg L.P. The data contained herein is not guaranteed as to its accuracy or completeness and no warranties are made with respect to results obtained from its use. While every effort is made to provide reports free from errors, they are derived from data received from one or more third parties and, as a result, complete accuracy cannot be guaranteed.
Index and ETF performances [MSCI and VNQ and FNER and LBUSTRUU] are presented as a benchmark for reference only and does not imply any portfolio will achieve similar returns, volatility or any characteristics similar to any actual portfolio. The composition of a benchmark index may not reflect the manner in which any is constructed in relation to expected or achieved returns, investment holdings, sectors, correlations, concentrations or tracking error targets, all of which are subject to change over time.
Leave a Reply Cancel reply
for more info on our strategy
go now →
for more info on our strategy
go now →
VIEW CHILTON'S LATEST
Media Features
go now →
Contact Us
READ THE LATEST
REIT Outlook
go now →
disclaimers
terms & conditions & FORM ADV
SITE CREDIT
Navigate
HOME
TEAM
REITS 101
Approach
OUTLOOKS
media
Contact
back to top
VISIT CHILTON CAPITAL MANAGEMENT
This property and any marketing on the property are provided by Chilton Capital Management, LLC and their affiliates (together, "Chilton"). Investment advisory services are provided by Chilton, an investment adviser registered with the SEC. Please be aware that registration with the SEC does not in any way constitute an endorsement by the SEC of an investment adviser’s skill or expertise. Further, registration does not imply or guarantee that a registered adviser has achieved a certain level of skill, competency, sophistication, expertise or training in providing advisory services to its advisory clients. Please consider your objectives before investing. A diversified portfolio does not ensure a profit or protect against a loss. Past performance does not guarantee future results. Investment outcomes, simulations, and projections are forward-looking statements and hypothetical in nature. Neither this website nor any of its contents shall constitute an offer, solicitation, or advice to buy or sell securities in any jurisdictions where Chilton is not registered. Any information provided prior to opening an advisory account is on the basis that it will not constitute investment advice and that we are not a fiduciary to any person by reason of providing such information. Any descriptions involving investment process, portfolio construction or characteristics, investment strategies, research methodology or analysis, statistical analysis, goals, risk management are preliminary, provided for illustration purposes only, and are not complete and will not apply in all situations. The content herein may be changed at any time in our discretion . Performance targets or objectives should not be relied upon as an indication of actual or projected future performance. Investment products and investments in securities are: NOT FDIC INSURED • NOT A DEPOSIT OR OTHER OBLIGATION OF,OR GUARANTEED BY A BANK • SUBJECT TO INVESTMENT RISKS, INCLUDING POSSIBLE LOSS OF THE PRINCIPAL AMOUNT INVESTED. Investing in securities involves risks, and there is always the potential of losing money when you invest in securities including possible loss of the principal amount invested. Before investing, consider your investment objectives and our fees and expenses. Our advisory services are designed to assist clients in achieving discrete financial goals. They are not intended to provide tax advice, nor financial planning with respect to every aspect of a client’s financial situation, and do not incorporate specific investments that clients hold elsewhere. Prospective and current clients should consult their own tax and legal advisers and financial planners. For more details, see links below to CRS (Part 3 of Form ADV) for natural person clients; Part 2A and 2B of Form ADV for all clients regarding important disclosures.