
Triple Net REITs: Becoming Constructive on Stable Spreads | November 2025
After we discussed triple net REITs in our June 2021 REIT Outlook, rising interest rates turned spread math into a moving target. From 2022 to 2024, higher weighted average cost of capital (or WACC), a slower transaction environment, and shifting acquisition cap rates made value creation difficult to underwrite. In 2025, the pieces are finally settling. Acquisition cap rates are stabilizing, the transaction market is coming back, and financing costs are firming. This puts the focus back on spread math rather than an interest rate call and allows us to get selectively constructive on net lease platforms that can convert that spread into per-share earnings and dividend growth.
What is a Triple Net REIT?
Simply put, triple net (or net lease) REITs own properties that are leased under contracts where the tenant pays the property taxes, insurance, and maintenance capital expenditures (the three ‘nets’). The shift of obligations from landlord to tenant makes the sector high margin, predictable, and highly scalable. Leases are typically 10-20 years, rents escalate each year (often fixed 1-2% or tied to CPI), and cash flows are largely insulated from day-to-day operating volatility.
Compared with other REIT sectors, triple net behaves more like a portfolio of long-duration, investment-grade style bonds with some embedded growth. Additionally, the sector is less cyclical than apartments or hotels, requires less landlord capex than retail or healthcare, and carries lower staffing needs than self-storage or data centers. The trade-off is that organic growth is relatively modest, so long-term value creation depends largely on investment spreads and volume (i.e., buying new assets at cap rates above the REIT’s blended cost of capital).
Why the Triple Net Platform Makes Sense
At its core, the net lease platform is advantageous for four key reasons:
- Diversification reduces idiosyncratic risk. The direct owner of a single store faces concentrated cash flow risk. A public REIT such as NNN REIT (NYSE: NNN) aggregates thousands of leases across a wide range of tenants, geographies, and industries, turning an individual store closure into statistical noise. It is for this reason that diversified net lease REITs should trade at a premium to their asset value, in theory.
- Scalability with high margins and minimized overhead costs. Because tenants cover taxes, insurance, and maintenance, net lease companies can run multi-billion-dollar portfolios with relatively small teams. For instance, Realty Income (NYSE: O), the largest triple net REIT, has an enterprise value (total market cap plus total debt minus cash) of $83 billion with only 468 employees. This implies an enterprise value of $177 million per employee, roughly 16 times that of the largest self-storage REIT, Public Storage (NYSE: PSA), at $11 million. Scale allows more net operating income (property income minus property expenses, or NOI) to fall to adjusted funds from operations (or AFFO), while general and administrative expenses remain low at ~40 bps on average as a percentage of the asset base. In practice, this translates into structurally higher margins, with net lease REITs often sustaining AFFO margins in the mid-70% range versus most other operating REITs in the mid-50s to low-60s, all else equal.
- Abundant and lower cost of capital. Investment grade unsecured debt, forward equity programs, joint ventures, and preferred equity allow public platforms to raise capital at relatively attractive rates and to harvest spreads consistently. Private buyers can compete on price for single assets, but the public wrapper and the ability to arbitrage equity when net asset value (or NAV) premiums exist has historically compounded value.
- Superior liquidity. It is much easier to buy and sell shares of a public net lease REIT than to transact in the private market, which can take months to close. That liquidity merits a premium and is a real advantage versus private peers.
Recent private market activity underscores these advantages, with large portfolio buyers and specialist sponsors active in single tenant retail and industrial sale-leasebacks. For example, in June 2024 RCG Ventures acquired a 99-property multi-tenant retail portfolio from Global Net Lease (NYSE: GNL) for $1.8 billion. In addition, Starwood Property Trust (NYSE: STWD) acquired Fundamental Income, a Brookfield-owned net lease operating platform, for $2.2 billion earlier this year.
What Triple Net REITs Actually Own
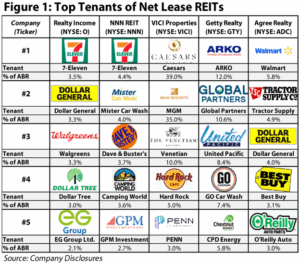
Portfolio composition is crucial because it drives the likelihood and magnitude of credit losses, the risk of occupancy fallout, and ultimately valuation. While net lease REITs have become increasingly diversified, retail remains the anchor, contributing ~75% of annualized base rent (ABR) on average, with gaming, industrial, and other property types making up the balance. Within retail, exposure is often concentrated in grocery, quick service restaurants (QSRs), casual dining, convenience stores, and a growing auto services and car wash segment as shown by the top five tenants of a few net lease REITs in Figure 1.
Bankruptcy Case Studies
Lease structure, transparent reporting, and credit quality are the core defenses in this sector. Master leases force all-or-nothing decisions in restructuring, unit-level reporting sharpens underwriting, and diversified, investment-grade tenants reduce surprise credit events.
One of the clearest recent tests came in May 2024 from the Red Lobster Chapter 11 process as it related to Broadstone Net Lease (NYSE: BNL). Broadstone owned 18 Red Lobster restaurants under a single master lease that represented ~1.6% of ABR. In bankruptcy, a debtor must assume or reject each lease, and a ‘master lease’ forces an ‘all-or-nothing’ decision across the portfolio. The outcome here was favorable for BNL as Red Lobster assumed the master lease, all 18 sites continued to operate, and rent continued on existing terms. Beyond the automatic stay period, there was no rent interruption, and downtime was de minimis, consistent with initial underwriting. As a parallel, VICI Properties (NYSE: VICI) has long-dated master leases and corporate guarantees from partners such as MGM Resorts (NYSE: MGM) and Caesars Entertainment (NASDAQ: CZR) that create high visibility and strong alignment, an advantage that shows up most in stressed environments.
As a contrast, Regal Cinemas and EPR Properties (NYSE: EPR) illustrate a different path. Cineworld filed for bankruptcy in September 2022, representing ~13% of EPR’s annualized base rent at the time of filing. Over the next nine months, EPR collected a mix of partial cash plus deferred rent and entered interim management agreements on select locations. Finally, in June 2023, the parties executed a new master lease covering 41 of the 57 theaters, with five boxes being re-leased to other operators and the other 11 being marketed for sale. Net of the process, EPR was able to recapture ~96% of pre-bankruptcy Regal rent through improved lease terms, but investor confidence was tested as EPR’s shares fell ~35% from August 7, 2022, to September 30, 2022, following the announcement of Cineworld’s initial filing. This underscores how uncertainty, not just cash flow, drives near-term stock moves and has the ability to deteriorate management credibility.
Furthermore, bad debt expense remains consistently low for high-quality platforms. For example, NNN has historically run at roughly 30-40 bps of revenue per year and is currently tracking ~15 bps year-to-date 2025, below trend. Persistently low loss reflects diversified portfolios, strong lease structures (including master leases) and higher-quality tenants, one reason tenant restructurings rarely impact long-term cash flows.
Investment “Spread Math” Simplified
Shifting gears to the all-important “spread math”, one of the key drivers to AFFO per share growth for the net lease sector. External growth is governed by two main levers:
- The investment spread. This is the difference between the acquisition cap rate and the REIT’s blended cost of capital (a weighted mix of the cost of debt and the implied cap rate on equity). For reference, the implied cap rate is the NOI yield implied by a REIT’s enterprise value, effectively the return the market requires on the stock. A positive investment spread means new investments should be accretive to per share earnings growth, all else equal.
- The pace of deployment. The contribution to AFFO per-share from external growth is approximately the investment spread multiplied by acquisition volume, then divided by the beginning asset base.
As an example, assume a REIT with a blended cost of capital of 6.4% acquires at a 7.2% acquisition cap rate and closes acquisitions equal to 20% of beginning period assets. The investment spread is 80 bps and when multiplied by 20%, the result is roughly 160 bps of AFFO per-share growth purely from external growth before considering equity timing and any modest slippage. If spreads compress or growth slows, the math can scale down quickly. If spreads widen and growth stays robust, the math equivalently scales up. In addition, using debt and free cash flow can boost AFFO accretion.
With acquisition cap rates now in the low-7s and blended costs generally in the low-6s for better-positioned platforms, spreads have normalized towards long-term levels as presented in Figure 2.
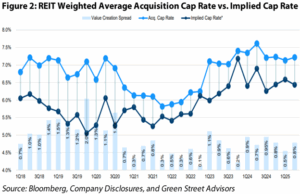
When a net lease REIT trades at a premium to NAV, its implied cap rate falls, lowering the equity component of its blended cost of capital. That widens the spread to acquisition cap rates, so deployment is even more accretive to AFFO per share. Just as important, retained free cash flow (AFFO less dividends) helps fund annual acquisition volume, reducing reliance on new capital, lowering costs, and compounding per share growth over time. The reverse is true at a discount, which is why protecting the premium and consistently generating free cash flow are so important.
Attractive Valuation vs. History
Looking back, triple net REITs have historically traded at notable premiums to their respective NAVs because the public wrapper converts equity premiums into accretive growth (if utilized correctly). Over the past decade, the sector averaged a NAV premium of +25% versus the REIT average at 0%. As of October 31, 2025, the sector trades closer to a modest premium on a weighted basis at +10%; however, the dispersion among triple net REITs is wide. Agree Realty (NYSE: ADC) and Essential Properties (NYSE: EPRT) command healthy premiums (+40%) given robust sourcing engines and best in-class per-share growth, while other stable platforms such as NNN and VICI trade closer to NAV parity and a few smaller names such as GTY and FrontView REIT (NYSE: FVR) trade at slight-to-significant discounts.
On an AFFO multiple basis, the group trades in the low-to-mid-teens as of October 31, 2025, roughly 1.5x below its 10-year historical average at ~15x and well below the broader REIT average at ~20x. Several high-quality names such as NNN have been trading near 12x forward AFFO recently vs. mid-teens over the past decade, meaning any progress toward historical ranges would be a tailwind for total returns.
What Earns a Premium to NAV
As previously stated, a premium to NAV is rocket fuel for growth, and since we began following the sector, four attributes have stood out that consistently earn said premium.
- Visible ability to compound AFFO per share. Investors reward platforms that repeatedly deploy capital at scale. The signals we watch for include investment spreads that are stable or rising, high acquisition volume relative to the asset base, and clean AFFO per-share growth on a consistent basis.
- Long-duration leases, long-weighted debt maturities, and a strong balance sheet. Well laddered unsecured debt, modest floating exposure, ample revolver capacity, and duration matching between lease terms and debt maturities reduce risk and enhance flexibility. Credibility improves when a company sets a leverage range and stays within it.
- A sourcing edge that is difficult to replicate. Programmatic sale-leasebacks with fixed or CPI-linked escalators, access to unit-level reporting, and strong seller relationships often signal durable advantages.
- Portfolio quality and transparency. Higher rent-coverage ratios, master leases, and low tenant concentration keep downside risk manageable. Improved tenant reporting also reduces the chance of surprise credit events.
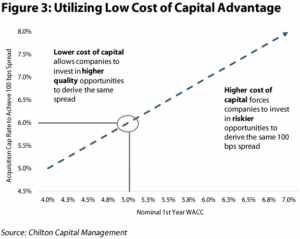
When these pieces are in place, REIT equity behaves like low-cost currency, igniting the “flywheel effect”. Visible AFFO per share growth from the widened investment spread helps sustain, or even expand, the premium to NAV, keeping the blended cost of capital low and enabling the next leg of accretive external growth. Management can buy higher quality real estate for similar spreads to peers or achieve even wider spreads at the same quality level, as illustrated in Figure 3.
Why We’ve Been Consistently Underweight
Our investment framework rewards organic cash flow growth and low NAV premiums, conditions that are not always present in net lease. Over the past several years our Chilton REIT strategy has maintained an underweight allocation to the sector as shown in Figure 4. Aside from 2022, when the defensive nature of the group led to outperformance during a rapid rise in interest rates, the underweight proved correct as the sector subsequently lagged the MSCI U.S. REIT Index (Bloomberg: RMZ) by 1,400 bps and 900 bps in 2023 and 2024, respectively.
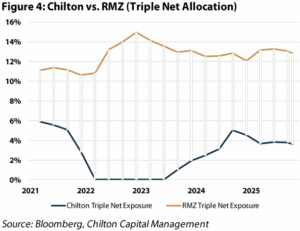
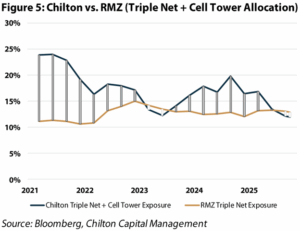
The picture changed in 2025. Triple net REITs are outperforming year-to-date (+10% vs. +3% for the RMZ), supported by defensive investor sentiment during tariff uncertainty and by a more stable cost of capital as the Federal Reserve pivot progresses. While we acknowledge that our sizable underweight is a risk, our composite has historically captured adjacent long-duration cash-flow exposure through our cell tower holdings, which share a comparable long-lease, low-overhead model, but offer greater potential organic growth. We’ve slowly moved toward a more neutral stance as indicated in Figure 5, but look to get selectively constructive again through high-quality platforms discussed in more detail below.
Chilton’s Selective Positioning
With the setup outlined above, we are prioritizing three platforms that fit our playbook on balance sheet strength, unique diversification, and durable cash flow.
Core Net Lease: NNN REIT
NNN has a conservative balance sheet, long tenor unsecured debt, and a seasoned retail platform that has delivered steady occupancy and dividend growth for over 36 years. We view NNN as a core income compounder that can lean in as spreads firm. Current valuation provides an attractive entry point relative to history and for reference, NNN is projected to acquire ~$700 million at a 7.4% cap rate in 2025, a near record. This equates to a 6.5% increase to its initial asset base.
Gaming & Experiential Specialist: VICI Properties
VICI has long master leases with CPI-linked escalators and reputable partners such as Caesars and MGM Resorts that create a differentiated demand setup relative to consumer retail. Recent expansions into experiential assets such as Bowlero and One Beverly Hills highlight the unique diversification VICI provides.
Convenience Retail Focus: Getty Realty
GTY focuses on convenience, auto services, car wash, and QSRs where unit economics are transparent, sale leaseback opportunities are expanding, and the roughly 7% dividend yield is well covered. Note that GTY is not held in our core portfolio and is included only in our Chilton REIT Income strategy.
Key Risks
While our outlook is constructive, several risks could affect investment spreads, credit outcomes, and AFFO per share growth over the next 12 months.
Our main watch items are: (i) competition from 1031 buyers, which can narrow private-market spreads; (ii) volatile interest and implied cap rates, which can compress spreads; (iii) shifts in terminal value as location importance can swing as retail formats evolve; and (iv) credit health of top tenants on watch list.
At this time, we’re comfortable with these risks for our names given their diversified portfolios, the use of master leases and unit-level reporting, and conservative balance sheets that preserve flexibility.
Conclusion
Net lease REITs have returned to being “spread businesses” rather than interest rate trades of the past two years. The sector’s valuations, the stability of the acquisition markets, and the ongoing need for corporate sale leaseback capital create a favorable backdrop. We’re getting more constructive on the sector and would look to add selectively through higher-quality platforms where the blend of cost of capital, sourcing capabilities, and balance sheet strength support durable AFFO per-share growth going forward.
Isaac A. Shrand, CFA
ishrand@chiltoncapital.com
(713) 243-3219
Matthew R. Werner, CFA
mwerner@chiltoncapital.com
(713) 243- 3234
Bruce G. Garrison, CFA
bgarrison@chiltoncapital.com
(713) 243-3233
Thomas P. Murphy, CFA
tmurphy@chiltoncapital.com
(713) 243-3211
RMS: 3,058 (10.31.2025) vs. 2,966 (12.31.2024) vs. 3,177 (12.31.2021) vs. 1,433 (3.23.2020)
An investment cannot be made directly in an index. The funds consist of securities which vary significantly from those in the benchmark indexes listed above and performance calculation methods may not be entirely comparable. Accordingly, comparing results shown to those of such indexes may be of limited use.)
The information contained herein should be considered to be current only as of the date indicated, and we do not undertake any obligation to update the information contained herein in light of later circumstances or events. This publication may contain forward-looking statements and projections that are based on the current beliefs and assumptions of Chilton Capital Management and on information currently available that we believe to be reasonable, however, such statements necessarily involve risks, uncertainties and assumptions, and prospective investors may not put undue reliance on any of these statements. This communication is provided for informational purposes only and does not constitute an offer or a solicitation to buy, hold, or sell an interest in any Chilton investment or any other security. Past performance does not guarantee future results.
Information contained herein is derived from and based upon data licensed from one or more unaffiliated third parties, such as Bloomberg L.P. The data contained herein is not guaranteed as to its accuracy or completeness and no warranties are made with respect to results obtained from its use. While every effort is made to provide reports free from errors, they are derived from data received from one or more third parties and, as a result, complete accuracy cannot be guaranteed.
Index and ETF performances [MSCI and VNQ and FNER and LBUSTRUU] are presented as a benchmark for reference only and does not imply any portfolio will achieve similar returns, volatility or any characteristics similar to any actual portfolio. The composition of a benchmark index may not reflect the manner in which any is constructed in relation to expected or achieved returns, investment holdings, sectors, correlations, concentrations or tracking error targets, all of which are subject to change over time.
Leave a Reply
for more info on our strategy
go now →
for more info on our strategy
go now →
VIEW CHILTON'S LATEST
Media Features
go now →
Contact Us
READ THE LATEST
REIT Outlook
go now →


