
Self-Storage REITs: Poised for an Inflection… But When? | March 2026
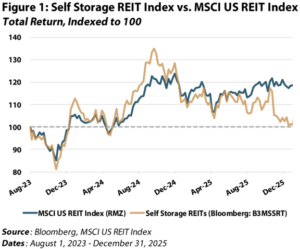
Since the last Chilton REIT Outlook covering the self-storage sector was released in August 2023, “Self-Storage REITs: A Cautious Outlook for a COVID Winner”, the sector has faced several headwinds. Over the 29 months ending December 31, 2025, self-storage REITs generated a total return of +1%, trailing the MSCI U.S. REIT Index (Bloomberg: RMZ) by roughly 1600 basis points, as shown in Figure 1. However, performance has improved quickly to start 2026, with self-storage now outperforming nearly every REIT sector year-to-date, up +17% vs. +11% for the RMZ.
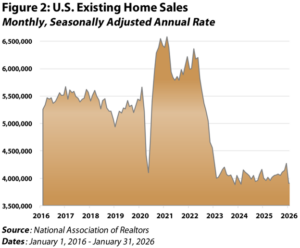
The underperformance was largely the outcome we were bracing for when we published our cautious view in August 2023. Existing home sales, a key driver of storage demand, have remained historically low (Figure 2) while new supply kept pressure on move-in rents and leasing velocity. In response, operators focused on defending occupancy through heavier promotions, expense management, and existing customer rent increases (ECRIs). These levers may have helped prevent a sharper downturn, but they have not been enough to offset stubbornly low market rents.
Fortunately, supply is trending lower from the post-pandemic peak, year over year comparisons are easing, and management tone has become more constructive. At the same time, self-storage should benefit from the advent of artificial intelligence (AI), which can support both expense management and revenue growth through improved dynamic pricing and digital lead conversion. Optimism has also been helped by the renewed national policy focus on housing affordability, which many believe could ultimately support higher housing turnover and increase storage demand. However, until we see more consistent evidence of a turn in fundamentals, we remain relatively underweight the sector.
The 5 D’s of Demand
Self-storage demand is notoriously difficult to forecast because it is driven more by life events than traditional GDP trends. In simple terms, most move-in demand falls into five buckets known as the “5 D’s”: dislocation, divorce, downsizing, death, and decluttering.
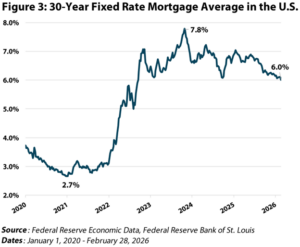
The key debate for 2026 continues to revolve around dislocation, as housing turnover remains the cleanest proxy for incremental move-in activity. Since 2023, existing home sales in the U.S. have been near historic lows (Figure 2) largely due to the “lock-in effect”. With ~80% of existing mortgages carrying rates below 6%, homeowners have been reluctant to give up low-rate financing. Mortgage rates have come down from their 25-year high of 7.8% in October 2023 (Figure 3), but rates likely need to move lower from here before mobility returns in a material way.
Housing affordability re-entered the spotlight early this year. Most notably, the administration issued an Executive Order aimed at limiting large institutional investors from competing with individuals for single-family homes, and pushed for a $200 billion mortgage-backed securities (MBS) purchase program via Fannie Mae and Freddie Mac in an effort to lower mortgage rates. While the headlines have clearly boosted sentiment, our view is that limiting institutional buyers is unlikely to have a significant effect on home prices, and a $200 billion purchase of MBS may help compress the spread between the 10-year Treasury yield and the 30-year mortgage rate, but a further decline in the 10-year Treasury yield will be needed to bring mortgage rates low enough to restart mobility.
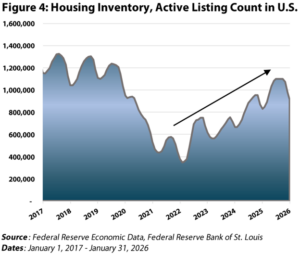
In spite of the optimism apparent in self-storage’s year-to-date performance, the housing data has not started to make a positive turn. In fact, existing home sales in January 2026 declined 8.4% month-over-month, the largest drop in nearly four years. On the positive side, for-sale housing inventory has improved modestly off the lows (Figure 4), which can be a leading indicator for home sales. We are closely watching these metrics and need to see other data confirm that mobility has increased before getting too excited about the sector.
Supply Turning Toward Tailwind
After several years of outsized deliveries, the development pipeline appears to have finally settled down. Annual supply growth is projected to be approximately 1.5% of existing inventory from 2025 through 2027, well below the ~2.4% long-term average (Figure 5). Higher land and construction costs, tighter lending standards, and difficulty underwriting future rents have kept new projects from penciling, which should continue to be the case without a meaningful change in market rents.
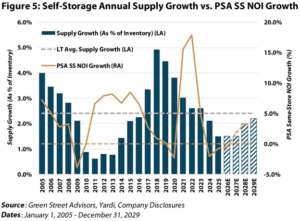
It is also important to remember that supply pressure is not one and done. New facilities take time to lease up and become fully competitive, and the impact is often felt over a multi-year window. That lag is what makes today’s low supply growth rate so important for the outer years. As the 2021-2024 vintage supply continues to be absorbed, a sub-2% supply environment in 2025-2027 should increasingly translate into a real tailwind for 2027-2029 fundamentals.
We saw a similar dynamic last cycle. Following the depressed supply period in 2010-2014 (Figure 5), Public Storage’s (NYSE: PSA) same-store net operating income (NOI) growth improved from -4% in 2009 to roughly flat in 2010, then expanded to and largely held in the range of +6% to +8% from 2011-2016 as competition from new supply became less of an issue.
Fundamentals Stabilizing
From an operating standpoint, self-storage REITs need a recovery in move-in rates (street rates) before seeing a return to historical average same-store NOI growth. Right now, the gap between move-in and move-out rents is still remarkably wide and negative. As shown in Figure 6, PSA’s move-in vs. move-out spread is sitting at its weakest level on record, with the rent roll-down widening to -42% in 4Q25 (move-ins of $11.60/sf vs. move-outs of $20.12/sf) compared with -34% in 3Q25. In the meantime, ECRIs can somewhat support in-place performance due to the “stickiness” of tenants, but higher move-in rents are critical for supporting growth in cash flow.
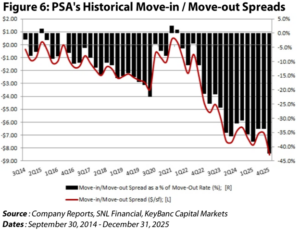
The rather ugly chart in Figure 6 reflects the hangover from heavy discounts and a weak move-in environment, while move-outs remain anchored to rents set during a much stronger period and subject to frequent ECRIs. Positively, this dynamic can flip when promotions begin to fade and street rates firm into the seasonally stronger April and May leasing window. With the trend still negative, we are comfortable with our underweight position, understanding that the data can flip quickly.
AI and Technology
For years, the self-storage REITs have embraced technology to enhance operations and were early leaders in mastering the benefits of search engines such as Google. That first-mover advantage created a real competitive edge in a commodity-type business. We believe that the adoption of AI can extend this edge and meaningfully improve margins through not only incremental cost savings (labor hours, utility usage, etc.), but also real revenue upside. Operators are constantly balancing prices, promotion strategies, and conversions, all while reacting to competitors at a trade-area level. The advantage shifts to platforms that can process more data, react faster, and optimize across multiple levers rather than pulling one lever at a time.
We are already seeing this play out among the REITs. PSA disclosed that ~85% of customer transactions and interactions are now digital, and management highlighted practical use cases including an AI-enhanced call center, improved search marketing, and machine-learning tools embedded in revenue management. Extra Space (NYSE: EXR) made a similar point, emphasizing how AI is changing search and discovery and that larger operators can adapt faster by deploying resources across pricing and marketing workflows. AI will not change where we are in the cycle, but it should raise the sector’s operating floor when demand is soft and improve the path to upside when demand recovers.
Valuation Analysis
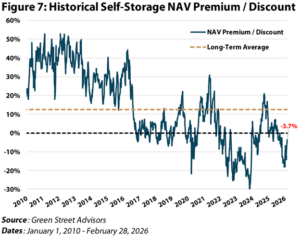
Self-storage REITs started 2026 trading at an 18% discount to net asset value (NAV), the lowest point in nearly two years. After the sector’s early-year rally, that has tightened to about a 4% discount, as shown in Figure 7. While a meaningful re-rating, it still sits well below the sector’s long-term average premium of ~12% and modestly below the more recent 10-year average premium of ~2%. We do not assume the sector will revert back to the peak premiums of the 2010s, but a structural case for a premium valuation still exists given the sector’s low capital expenditure burden, resilient cash flow profile, low obsolescence risk, and operating leverage that comes with scale, data, and lower overhead.
As of February 28, 2026, self-storage REITs trade at ~19.0x expected 2026 AFFO, which compares to the REIT weighted average of about ~22.5x. Over the past 20 years, self-storage REITs have averaged a two-turn AFFO multiple premium to the broader REIT universe, but that premium was earned during periods of superior growth. With 2026 guidance calling for flat to modestly negative earnings growth across most of the sector (with the sole exception being SMA at +6%), the lack of a multiple premium to the average REIT growing earnings ~5% feels justified for now.
Public Storage: The Blue-Chip Behemoth
Within the sector, we maintain exposure through both PSA and SMA for several reasons, with PSA remaining our core holding. Public Storage is the leader in the sector with a market capitalization north of $50 billion and a geographically diverse portfolio spanning more than 3,500 facilities, towering over SmartStop’s roughly 180 store footprint. Beyond the recent completion of its six-year, $600 million “Property of Tomorrow” initiative, which rebranded and modernized all 3,500+ properties, PSA unveiled PS4.0™. The announcement marked a leadership transition, a headquarters relocation to the Dallas area after over 50 years in California, and the launch of its next-gen operating platform, PS Next™, built around improving the customer experience and driving better organic performance for years to come.
From a capital allocation standpoint, PSA’s balance sheet remains best-in-class, supported by an A2 credit rating, low leverage, and one of the lowest costs of debt among publicly traded REITs. In addition, G&A expense as a percentage of enterprise value ranks second lowest across all REITs, same-store parameters remain conservative vs. peers, and the non-same-store pool offers ~$70 million (or ~$0.40/share) of incremental NOI upon stabilization. PSA also benefits from its sizable high-margin ancillary business, including tenant reinsurance and third-party management, which together generated over $330 million of revenue and close to $200 million of NOI in 2025.
SmartStop: The Little REIT That Could
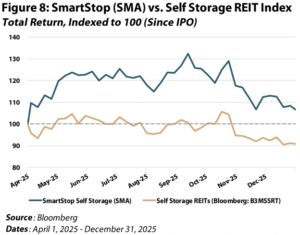
SmartStop has given us a differentiated way to play the next leg of the cycle. Since initiating our overweight position after participating in its IPO on April 1, 2025, SMA outperformed peers by ~1,500 bps (Figure 8) to close out 2025. Despite the large-cap group having already re-rated considerably, SMA still sits at a high-teens discount to NAV and trades at an AFFO multiple about two turns below peers. With a roughly ~$2 billion equity market cap vs. EXR and PSA closer to $30 billion and $50 billion, respectively, external growth can significantly move the needle here.
In addition to potentially accretive acquisitions, SMA has other growth drivers at its fingertips. In October 2025, SMA acquired Argus, unlocking a scaled third-party management platform with a going-in EBITDA yield around 12%, while simultaneously widening the acquisition funnel and supporting NOI margin expansion over time. On the funding side, the company has shown it can tap lower-cost Canadian capital, including a CAD $200 million Maple bond at a 3.89% coupon maturing in 2030, representing interest rate savings of ~100 bps vs. a comparable U.S. issuance. When considering its differentiated Canadian footprint and managed REIT platform, which generates recurring fee income and acquisition pipeline visibility, SMA offers several pathways to compound earnings even if the sector’s recovery stays gradual.
Conclusion
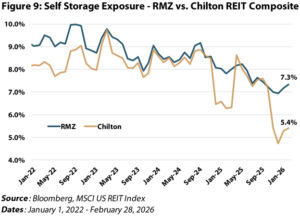
After roughly two and a half years of uncertainty and relative underperformance, self-storage feels closer to an inflection point, even if the data has not fully caught up yet. Supply is no longer expanding at an overwhelming rate, market breadth is improving, and the sector is increasingly benefiting from platforms and technology that can help monetize the next leg of fundamentals when demand firms. Still, housing turnover remains the major swing factor, and until we see clearer evidence that move-in rents are rising and discounting is fading, we believe a modest underweight remains appropriate (Figure 9) despite the sector’s strong start to 2026. Importantly, that discipline has served us well through the past few years, while our astute analysis of SMA provided strong relative performance amidst tough industry conditions in 2025.
With full-year 2026 guidance now largely set, the key debate is less about this year’s prints and more about whether spring and summer operating data builds confidence in a stronger 2027 setup. If move-in rent gaps begin to close, promotions fade, and the housing market shows genuine signs of thawing, we expect to become constructive on the sector and will adjust our exposure accordingly.
Isaac A. Shrand, CFA
ishrand@chiltoncapital.com
(713) 243-3219
Matthew R. Werner, CFA
mwerner@chiltoncapital.com
(713) 243- 3234
Bruce G. Garrison, CFA
bgarrison@chiltoncapital.com
(713) 243-3233
Thomas P. Murphy, CFA
tmurphy@chiltoncapital.com
(713) 243-3211
RMS: 3,396 (2.28.2026) vs. 3,054 (12.31.2025) vs. 3,177 (12.31.2021) vs. 1,433 (3.23.2020)
An investment cannot be made directly in an index. The funds consist of securities which vary significantly from those in the benchmark indexes listed above and performance calculation methods may not be entirely comparable. Accordingly, comparing results shown to those of such indexes may be of limited use.)
The information contained herein should be considered to be current only as of the date indicated, and we do not undertake any obligation to update the information contained herein in light of later circumstances or events. This publication may contain forward-looking statements and projections that are based on the current beliefs and assumptions of Chilton Capital Management and on information currently available that we believe to be reasonable, however, such statements necessarily involve risks, uncertainties and assumptions, and prospective investors may not put undue reliance on any of these statements. This communication is provided for informational purposes only and does not constitute an offer or a solicitation to buy, hold, or sell an interest in any Chilton investment or any other security. Past performance does not guarantee future results.
Information contained herein is derived from and based upon data licensed from one or more unaffiliated third parties, such as Bloomberg L.P. The data contained herein is not guaranteed as to its accuracy or completeness and no warranties are made with respect to results obtained from its use. While every effort is made to provide reports free from errors, they are derived from data received from one or more third parties and, as a result, complete accuracy cannot be guaranteed.
Index and ETF performances [MSCI and VNQ and FNER and LBUSTRUU] are presented as a benchmark for reference only and does not imply any portfolio will achieve similar returns, volatility or any characteristics similar to any actual portfolio. The composition of a benchmark index may not reflect the manner in which any is constructed in relation to expected or achieved returns, investment holdings, sectors, correlations, concentrations or tracking error targets, all of which are subject to change over time.
Leave a Reply
for more info on our strategy
go now →
for more info on our strategy
go now →
VIEW CHILTON'S LATEST
Media Features
go now →
Contact Us
READ THE LATEST
REIT Outlook
go now →


