Apartment REITs: A Deep Dive into Supply/Demand Forecasting | June 2017
June 1, 2017
After 5 years of above average apartment REIT Same Store Revenue (SSRev) growth, concerns of increasing supply in 2016 threatened the outlook for the sector. As a result, apartments (Bloomberg: FNAPTTR) underperformed the MSCI US REIT Index (Bloomberg: RMS G) by 570 basis points (or bps) in 2016. Yet, in spite of the negative sentiment, the sector posted SSRev growth of +4.8%, well above the 3% historical average, though a deceleration from +5.6% in 2015.
On 4Q 2016 earnings calls, REIT management teams guided to further deceleration in 2017, but expected growth to stabilize near the historical average as supply peaks in the back half of the year. Our proprietary research of the supply and demand landscape supports the REITs’ views, indicating that revenue growth should stabilize in 2017 and could even reaccelerate through at least 2018.
New supply plays a significant role in revenue growth forecasts, but focusing solely on this metric can lead investors astray. Demand, usually represented by job creation, is an equally important factor in apartment fundamentals. For example, Austin, Texas delivered 30,186 new apartment units from 2014 to 2016 (15% of existing supply), which was enough to rank fifth highest in the entire country. Over the aforementioned period, annual SSRev growth was a robust +5.6%, based on a straight average of the properties owned in Austin by UDR (NYSE: UDR), Camden Property Trust (NYSE: CPT), and Mid-American Apartment Communities (NYSE: MAA). This compares to +4.4% for the apartment REITs as a whole. During this period, job growth equated to 120,000 jobs, an increase of +4.3% per year. Described below is our proprietary tool used to gauge apartment fundamentals at the national, regional, and MSA (Metropolitan Statistical Area) level and forecast REIT revenue growth, among other applications.
The Forecasting Tool
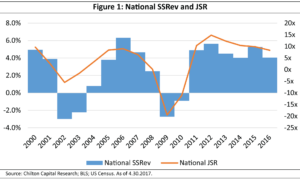
We believe the best measure to judge the health and outlook for an apartment market is by calculating a jobs to supply ratio (or JSR). A JSR is a measure of how many jobs are created for every new apartment unit delivered. The average JSR has historically been near 5x on a national basis, meaning demand for one apartment unit is created for every five new jobs. This is often used as the standard “equilibrium” point for analyzing a particular market. For example, a ratio above 5x indicates there is above average demand for apartments—a recipe rental rate growth—and vice versa for a ratio below 5x. Figure 1 shows a chart of the national JSR along with national apartment revenue growth. The national proxy uses the average of SSRev growth for AvalonBay (NYSE: AVB), Equity Residential (NYSE: EQR), CPT, and MAA, which own 302,500 units nationwide combined as of December 31, 2016. Notice the correlation between the JSR line and SSRev bar and how crossing the equilibrium JSR is often a signal for change in the trajectory of SSRev growth.

Though 5x works well nationally, the equilibrium JSR can vary by individual market depending on differences in home affordability and the lifestyle choices of people within a market, among other factors. For instance, dense, urban markets such as New York City would have lower equilibrium JSRs, while less-dense, more affordable markets such as Orlando, Florida would have higher equilibrium ratios.
Unfortunately, in our view, this creates a problem in comparing the relative attractiveness of markets on an absolute basis (i.e. a 5x ratio in New York City should not give an investor the same signal as a 5x ratio in Orlando). To compare the ratios across markets, we “normalize” them by using the percent change in the JSR from the historical average JSR by market. We have found that forecasting these metrics one year into the future provides relatively accurate conclusions about the apartment markets’ internal growth opportunities beyond guidance issued by management teams. Sometimes it can even call into question assumptions used in the company-provided forecasts!
Generating the Forecast
To forecast JSRs, we start with monthly multifamily permitting data (which includes construction permits for buildings with 5 or more units) from the Census Bureau and the year over year change in nonfarm employees by month from the Bureau of Labor Statistics. With this info, we make standard assumptions about the average construction timeline and conservatively forecast expected changes in the job growth environment to arrive at an estimated trailing twelve month JSR. Our proprietary research allows us to conduct varying types of analyses at the national, regional, or even MSA level, all of which help to frame our views on the sector and individual companies.
In our analysis of the apartment sector, we use a top-down approach comprised of the national and regional data—broken down by Midwest, Northeast, South, and West—to frame our general stance on the overall fundamentals. It also helps to determine whether certain regions are skewing the national data. We currently forecast apartment supply to peak in the back half of 2017, though current data does not project a steep drop from 2017 to 2018 (meaning supply could still be elevated). However, generalizing about the REIT portfolios based on national level information is dangerous and can often be misleading.
The second step in our process is a bottom-up analysis using MSA data to draw company-specific conclusions based on individual market exposure. It also generally enables us to confirm or explain trends seen on a regional level. For example, in June 2015, there was an uptick in new supply in the national data driven by the northeast region. A deeper dive on the MSA level showed the increase in supply was primarily driven by a change in tax incentives in New York City and was not indicative of a national or regional trend.
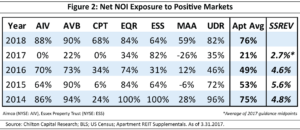
Third, we link the MSA data to the REIT portfolios to test trends and comparisons. In one recent study, we analyze apartment REIT portfolios by their exposure to markets with strong or improving fundamentals. To do this, we label each market as either “positive” or “negative”. We regard a positive market has one having a forecasted JSR above either the market’s historical average or the current level. A market that does not meet either of these requirements is labeled as negative. In Figure 2, we have listed the historical net exposure to positive markets by REIT and by year from 2014-2018, as well as the average apartment SSRev growth. In this analysis, higher exposure to positive markets has coincided with above average revenue growth. It also supports our view for positive fundamentals into 2018.

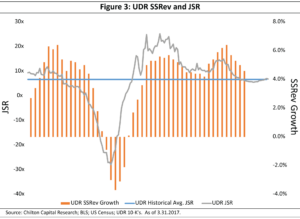
Lastly, we use forecasted JSRs, historical SSRev growth, and a few other assumptions to create predictive equations for future SSRev growth by REIT. As an example, Figure 3 shows a summary of UDR’s metrics. Note the similarity between the JSR line and SSRev bars which supports the high correlation between the two. The flattening and forecasted increase in the JSR is what gives us confidence in the outlook for UDR and many other apartment REITs using this methodology. In practice, we can calculate an estimate for 2018 SSRev for each REIT, which can then be compared to consensus estimates and factored into our price targets.

Could the REITs be Wrong?
Many apartment CEOs led off 2017 with an outlook that SSRev growth would decelerate from 2016, but stabilize around the historical average growth rate by the end of the year. However, contrary to management commentary, apartment construction permitting data (the early indicator of new supply) has remained at an elevated level suggesting that supply could be flattening rather than peaking. In April, annual seasonally adjusted multifamily permits were 403,000 units nationally, up 4.1% year over year and 1.5% over the previous month (though permits were actually down 4.1% year over year on a trailing six month average basis—a more stable measure due to the volatility of monthly permit numbers).
However, there are some important caveats to consider when measuring future supply based permits. First, drawing opinions on apartment REIT market fundamentals using national data may be misleading. Given that each market or submarket will experience different levels of supply and job growth, the national numbers are not applicable to a non-national portfolio. In fact, based upon individual market exposures, our research shows that the apartment REITs are expected to see decreasing supply across most of their markets in 2018.
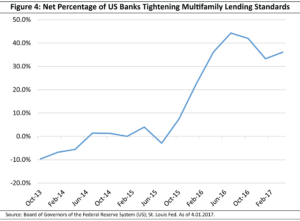
Second, not all permits are converted to new supply. Permits can be granted before the developer secures financing, procures materials, and hires contractors. We assume an 85% conversion rate, in-line with historical metrics, but, as many REIT CEOs pointed out on 1Q 2017 earnings calls, there are times when the conversion rate is higher and times when it is lower. Anecdotal evidence could point to lower conversion rates for the near future as development underwriting has become more difficult. First, land costs have continued to increase, while rental rate growth projections have decreased. Second, construction costs have also continued to rise. Concrete, gypsum, and softwood lumber, three major construction materials, have risen 7% over the past year and 30% over the past five years. Lastly, apartment development lending standards have continued to tighten (Figure 4), which should restrict the amount and type of financing available to apartment developers.

Risks to the Chilton Forecast
Though we have confidence in our forecast for apartment fundamentals, there are risks to consider. For one, our forecasts are only as good as the inputs. To limit the amount of assumptions that drive our estimates, we only estimate supply 16 months into the future.
Furthermore, we analyze companies based on MSA exposure. In reality, specific submarkets and even micro markets within MSAs can have fundamentals that vary significantly from each other and the MSA average. AVB’s “Metro NY/NJ” market (equivalent to the NYC MSA) serves as an example. Internally, AVB breaks up the Metro NY/NJ market into three submarkets “New York City, NY”, “New York – Suburban”, and “New Jersey”. Since 2013 (when the company began using these subcategories) through 2016, there has been an average annual dispersion of 150 bps in SSRev growth between the three markets. In contrast, our forecasting tool only provides an estimate for the entire New York City MSA.
Additionally, the tool is limited to forecasting revenue, which is only a portion of the net operating income (or NOI) calculation used to determine a REIT’s NAV (or Net Asset Value). Expense growth should be considered when determining the impact of fundamentals on valuation. One of the largest components is property taxes, which typically comprise 35% of operating expenses and increased an average of 5% in 2016. Payroll expense (the second largest line item) has also experienced upward pressure due to changes in healthcare costs and minimum wages.
Seeing Through the Fog
Supply is an important part of apartment fundamentals, but not the whole picture. Lately, we believe market participants have placed too much emphasis on near-term supply trends which has created opportunities for long-term active investors that can see through the fog and acknowledge the importance of market positioning and demand.
Our proprietary research and analysis gave us the conviction to overweight the apartment sector going into 2017, and we expect the sector to experience positive guidance revisions as the year progresses. We are also using apartment REITs as a hedge against rising interest rates that could reduce affordability of single family homes and increase the renter pool. Year to date, as of May 31, 2017, apartments have generated a total return of +4.4% versus +0.5% for the RMS.
The apartment forecasting tool is only one part of our research and investment process at Chilton. By using publicly available data and historical trend analysis, and combining it with our cash flow models, property tours, and meetings with management (across all sectors), we believe we could outperform the benchmark over a 1-3 year time frame in a repeatable fashion.
Bruce G. Garrison, CFA, bgarrison@chiltonreit.com, (713) 243-3233
Matthew R. Werner, CFA, mwerner@chiltonreit.com, (713) 243-3234
Blane T. Cheatham, CFA, bcheatham@chiltonreit.com, (713) 243-3266
Parker Rhea, prhea@chiltonreit.com, (713) 243-3211
RMS: 1914 (5.31.2017) vs. 346 (3.6.2009) and 1330 (2.7.2007)
Previous editions of the Chilton Capital REIT Outlook are available at www.chiltonreit.com/reit-outlook.html.
An investment cannot be made directly in an index. The funds consist of securities which vary significantly from those in the benchmark indexes listed above and performance calculation methods may not be entirely comparable. Accordingly, comparing results shown to those of such indexes may be of limited use.
The information contained herein should be considered to be current only as of the date indicated, and we do not undertake any obligation to update the information contained herein in light of later circumstances or events. This publication may contain forward looking statements and projections that are based on the current beliefs and assumptions of Chilton Capital Management and on information currently available that we believe to be reasonable, however, such statements necessarily involve risks, uncertainties and assumptions, and prospective investors may not put undue reliance on any of these statements. This communication is provided for informational purposes only and does not constitute an offer or a solicitation to buy, hold, or sell an interest in any Chilton investment or any other security.
for more info on our strategy
go now →
for more info on our strategy
go now →
VIEW CHILTON'S LATEST
Media Features
go now →
Contact Us
READ THE LATEST
REIT Outlook
go now →
disclaimers
terms & conditions & FORM ADV
SITE CREDIT
Navigate
HOME
TEAM
REITS 101
Approach
OUTLOOKS
media
Contact
back to top
VISIT CHILTON CAPITAL MANAGEMENT
This property and any marketing on the property are provided by Chilton Capital Management, LLC and their affiliates (together, "Chilton"). Investment advisory services are provided by Chilton, an investment adviser registered with the SEC. Please be aware that registration with the SEC does not in any way constitute an endorsement by the SEC of an investment adviser’s skill or expertise. Further, registration does not imply or guarantee that a registered adviser has achieved a certain level of skill, competency, sophistication, expertise or training in providing advisory services to its advisory clients. Please consider your objectives before investing. A diversified portfolio does not ensure a profit or protect against a loss. Past performance does not guarantee future results. Investment outcomes, simulations, and projections are forward-looking statements and hypothetical in nature. Neither this website nor any of its contents shall constitute an offer, solicitation, or advice to buy or sell securities in any jurisdictions where Chilton is not registered. Any information provided prior to opening an advisory account is on the basis that it will not constitute investment advice and that we are not a fiduciary to any person by reason of providing such information. Any descriptions involving investment process, portfolio construction or characteristics, investment strategies, research methodology or analysis, statistical analysis, goals, risk management are preliminary, provided for illustration purposes only, and are not complete and will not apply in all situations. The content herein may be changed at any time in our discretion . Performance targets or objectives should not be relied upon as an indication of actual or projected future performance. Investment products and investments in securities are: NOT FDIC INSURED • NOT A DEPOSIT OR OTHER OBLIGATION OF,OR GUARANTEED BY A BANK • SUBJECT TO INVESTMENT RISKS, INCLUDING POSSIBLE LOSS OF THE PRINCIPAL AMOUNT INVESTED. Investing in securities involves risks, and there is always the potential of losing money when you invest in securities including possible loss of the principal amount invested. Before investing, consider your investment objectives and our fees and expenses. Our advisory services are designed to assist clients in achieving discrete financial goals. They are not intended to provide tax advice, nor financial planning with respect to every aspect of a client’s financial situation, and do not incorporate specific investments that clients hold elsewhere. Prospective and current clients should consult their own tax and legal advisers and financial planners. For more details, see links below to CRS (Part 3 of Form ADV) for natural person clients; Part 2A and 2B of Form ADV for all clients regarding important disclosures.