Essential REIT Evaluation: Cell Towers and Data Centers | August 2020
August 1, 2020
One cannot go very far in today’s information age without seeing someone on a mobile device. As applications are built for so many facets of our daily lives, the need for a higher level of and faster data only grows. Even back in the mid 2000s just before the dawn of the smartphone, the Blackberry, a device that seems archaic now, was called the “Crackberry” after a network outage caused many users to be very anxious when not feeling connected by their devices. We would not want to see a replay of that today given how much more we use our smartphones! During the Great Financial Crisis in 2008 and 2009, data usage and corresponding cell tower (or ‘tower’) cash flows were remarkably resilient and actually grew through the recession. It is difficult to find another REIT business model that is more essential than towers. Moreover, the infrastructure needed to support these critical networks should only grow as 5G enables the Internet of Things (IOT) to develop at an accelerating pace. This infrastructure includes data centers as well, which has and will continue to play a key role in distributing compute power closer to where data is being generated, also known as the edge.
Cell Towers
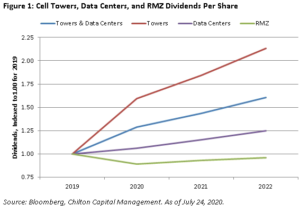
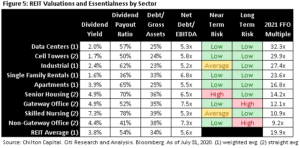
Tower networks are a scale game. Therefore, an oligopoly consisting of American Tower (NYSE: AMT), SBA Communications (NASDAQ: SBAC), and Crown Castle (NYSE: CCI) emerged to dominate the US and many international markets. The Chilton REIT Portfolio owns all three with a collective weight of 21.7% as of July 31, 2020, which compared to the MSCI US REIT Index’s (Bloomberg: RMZ) 0% weighting and the NAREIT All Equity REIT Index (Bloomberg: FNER) weight of 19.7%[1]. Given the world’s insatiable appetite for data, towers not surprisingly have a strong and enduring backdrop of growth, which helps investors overcome the group’s below average dividend yield of 1.7% compared to the RMZ dividend yield of 3.8%. The dividends are safe and growing well above average while the dividend payout ratios average 50%, which compares to the REIT average of 54%. As shown in Figure 1, the dividends are projected to grow well above the REIT universe.
Since the pandemic began to grip the economy in February, most traditional REITs such as regional malls, shopping centers, and office have had to defer or abate rents by varying degrees depending upon their tenant exposure and ‘essential’ status. Towers have had almost the complete opposite experience as rents continue to go up by contractual escalators as well as new leases at higher rents to account for the increased equipment necessary to support 5G networks.

The Chilton REIT team’s second assessment of essentialness is the balance sheet, which for towers comes in relatively in line with debt to gross asset value and net debt to EBITDA ratios of 24% and 5.8x, respectively. Meanwhile, the average REIT is leveraged 34% and 5.6x on those same two metrics. Although the leverage metrics are in line, we would argue towers have even safer balance sheets than seen at face value given the long term contractual nature of leases to high quality network carriers with ample access to capital.
Tower tenants AT&T, Inc. (NYSE: T), Verizon Inc. (NYSE: VZ), T-Mobile US, Inc. (NASDAQ: TMUS), and Dish Network Corp (NASDAQ: DISH) have had relatively steady cash flow generation through the course of the pandemic so far. Their network investment plans, including 5G, continue. Furthermore, both VZ and T have been reducing debt and refinancing existing borrowings to take advantage of lower rates. Not surprisingly, towers themselves have abundant access to the capital markets.
Due to their strong tenants, durable cash flows, and low long term risk, all three tower REITs were able to take advantage of the low interest rate environment to raise capital at record low rates. First, SBAC raised $500 million of 2027 senior notes at 3.875% on May 19. Then, on June 1 AMT issued $1.968 billion of 2025, 2030, and 2050 senior notes at 1.3%, 2.1% and 3.1%, respectively. Lastly, on June 4 CCI tapped the credit markets for $2.473 billion of 2025, 2031 and 2051 senior notes at rates of 1.35%, 2.25% and 3.25%, respectively.
It has taken time for fixed income investors to get comfortable with the business however. Figure 2 shows the spread compression between AMT’s 4.4% 2026 senior notes and the US 10 Year Treasury Note. Due to their low payout ratios, access to capital, and durability of cash flows, we rate the near term and intermediate term risk as low. The lower spread indicates that fixed income investors believe the issues company carries lower risk.

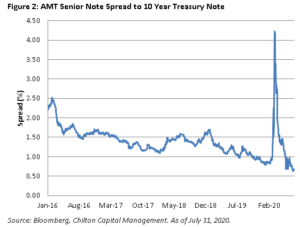
With respect to the tower companies’ long term risk, we believe it is also low given the secular demand for data in the decades to come, which is why we have been long time shareholders. Since near term, intermediate term, and long term risks are low, the greatest risk in our view is valuation. It is not surprising that the performance of the tower REITs has led the REIT market only trailing data centers. The straight average of AMT, SBAC, and CCI’s total returns since the market peak on February 21 is +4.4% versus the RMZ Index at -20.4%.
As of July 31, tower REITs are priced at an average 29.9x FFO compared to the broader REIT average of 19.9x. We are comfortable with these elevated valuations due to the strong fundamental outlook that is second to none in the REIT industry, namely the fact that communications infrastructure becomes more critical as time passes with little to no threat of new and viable competitive entrants.
Other investors are taking notice too. Activist investor Elliott Management recently bought over $1 billion of CCI, recommending reduced capital investment in its fiber business and a corresponding dividend increase of 46%. According to Elliott and other investors, the jury is still out as to whether fiber and small cells’ return on invested capital will improve as the number of tenants per node increases to two or more. Elliott argues that CCI will still be competitively positioned in both towers and fiber/small cells as 5G densifies communication infrastructure but with a more balanced approach to capital allocation. Though we don’t agree with increasing the dividend payout ratio to the level necessary to sustain a 46% higher dividend, we do agree that more disclosures around small cells and fiber would help investors to become more comfortable with management allocating such a large amount of capital in them.
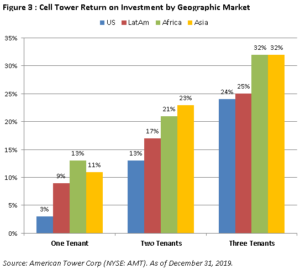
While CCI concentrates on the 5G opportunity in the United States, AMT and SBAC give our tower allocation nice geographic diversification as 45% and 20% of their revenues are derived from international markets, respectively. An additional driver in overseas markets is that many countries have a lower level of smartphone penetration compared to the United States. Furthermore, data usage per device is generally lower in less mature international markets, which leaves more growth runway for total data consumption. Lastly, international markets should contribute a positive mix shift as they garner higher return on invested capital as noted by AMT in Figure 3.

Data Centers
“Tied at the hip” with towers are data centers, which also play a critical role in supplying the necessary data in our increasingly digital world. In the unlikely chance that the benefits of a digital economy were underappreciated before the COVID-19 pandemic, they most definitely should not be now. The ability to conduct business online has helped keep productivity much higher than otherwise would have been as most of the global economy has been working from home.
The significantly greater amount of time spent working, studying, and communicating from home as well as buying online increased data consumption by 30% in March and has sustained these levels through May according to Nokia (NYSE: NOK). Even when the pandemic ends and some commerce is shifted back to brick and mortar, there should be resiliency in data growth due to the rate of adoption that has been pulled forward as businesses, consumers, and society at large have been forced to adapt. For instance, there has been a steady transformation in business enterprise IT systems from on-premise to the cloud for over a decade. Some companies elected to go fully into the cloud while some chose the hybrid approach, which leaves highly sensitive and mission critical applications in owned servers. Whether companies choose the cloud, physical data centers, or a mix between the two, data center REITs stand to benefit from the ongoing shift from company-owned and operated data centers to a third party solution in order to lower costs, increase efficiency, and allow for flexibility. The cloud providers such as Microsoft, Google, and Amazon are among the largest data center REIT tenants, so the REITs win regardless.
The largest data center markets, known as the ‘Big 5’, are comprised of Northern Virginia (or NoVA), Northern California, Dallas, Chicago, and Phoenix. Data center capacity is usually measured in power, or megawatts (or MW) in particular. Figure 4 illustrates the amount of MW capacity being absorbed each quarter. The pandemic has caused demand to surge in the first half of 2020 to near record levels last seen in 2018. NoVA, the largest of the five markets and through which 70% of internet traffic passes, saw significant strength. While benefiting from increased data usage across all areas of the economy, NoVA also houses large Federal contracts such as the Joint Enterprise Defense Infrastructure, or JEDI, which is a 10 year, $10 billion contract with Microsoft. Needless to say, that is an ‘essential’ contract.
Collections within the data center industry have been very strong and deferrals have been insignificant so far. For instance, QTS Realty (NYSE: QTS) said that tenants comprising less than 5% of its rental income requested deferrals and only a fraction of that would be granted. COR also noted that its rent relief requests were approximately 2-2.5% of revenue as of its 1Q20 earnings call and only half had been accepted.

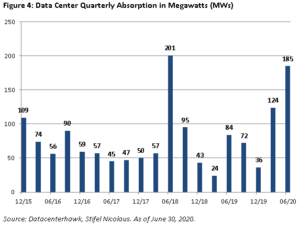
Since February 21st’s market peak, data centers have returned 19.0%, which compared to the RMZ total return of -20.4%. The bifurcation in market performance underscores how data centers have benefited from the unfortunate COVID-19 pandemic while more traditional cyclical businesses that are not designed to operate without physical presence have seen demand significantly impaired.
The Chilton REIT Portfolio’s allocation to data centers as of July 31 was 17.2%, a 2.0% overweight relative to the RMZ’s 15.2%. Our ownership is comprised of Equinix (NASDAQ: EQIX), Coresite (NYSE: COR), QTS, and CyrusOne (NASDAQ: CONE). The competitive positioning of these and most public data center REITs have been strengthening as more technological sophistication and global footprints are increasingly necessary to win large amounts of business. One sign to us that this is playing out is the decline of private players in the space as they find it more difficult to compete for large tenants without having a reliable track record or previous relationship. This dynamic should help temper oversupply risk in the long term as the industry consolidates towards larger public players.
Data center REITs, similar to the high growth tower REITs, sport relatively low but growing dividend yields. As of July 31, the data center average dividend yield was 2.0% with a FFO payout ratio of 57%, which compared to the RMZ’s dividend yield and payout of 3.8% and 54%, respectively. The secular demand for data as well as reasonable payout ratios should provide investors confidence that the sector’s dividends are safe and can grow at an above average rate.
The data center sector’s debt ratios are slightly lower than the typical REIT with debt to gross asset value of 25% and net debt to EBITDA of 5.3x compared to the RMZ index at 34% and 5.6x, respectively. Like the tower REITs, informed investors know that data centers’ balance sheets are more conservative than the numbers indicate given the contractual nature and longer duration of their leases. In addition, the net debt/EBITDA ratios are somewhat inflated due to the large development pipelines that require capital but are not presently producing EBITDA. On average, the development pipelines of data center REITs are 3.6% of total enterprise value, which compares to the REIT average of 2.9%.
Despite the economic tumult in the second quarter, investors lined up to provide capital to the group. On May 6, COR raised $150 million of 2027 senior notes at a cost of 3.75%. Then, on May 11 EQIX issued $1.5 billion of equity at $665 per share in an oversubscribed offering. By the end of the month, EQIX deployed $750 million of it to acquire 13 Canadian data centers from BCE Inc. (NYSE: BCE) at an attractive 15x EBITDA multiple. EQIX followed up the equity offering and acquisition with a debt offering on June 8 for a cumulative $2.6 billion of 2025, 2027, 2030 and 2050 notes at a cost of only 1.25%, 1.80%, 2.15% and 3.0%, respectively. Those rates would make most REITs envious. The combination of a safe dividend yield, solid balance sheets, and easy access to capital make data centers a low risk in the short to intermediate term.
Lastly, data center long term risk is low due to the difficulty of moving servers and the aforementioned secular growth drivers in data usage. Enterprises should find it less economical over time to keep their own servers in-house as IT needs grow and become more complex. These enterprises can’t afford to have mistakes or internal failures that prevent them from accessing their data and especially losing data. As an example, each REIT discloses their ‘uptime’ on an annual basis, which it uses to show tenants how reliable their facilities are. Most have had uptime of at least 99.999% (five 9’s), with some targeting uptime of 99.9999% (six 9’s)!
Additionally, the industry benefits from global data demand as well, which should serve not only as an added catalyst as foreign economies invest to keep pace with countries like the United States but also as a diversifier in the ebb and flow of domestic and international economies. After considering the essentialness datacenters have, it makes sense to us that they can garner valuation multiples of 32.3x 2021 FFO.

Observations Thus Far
As shown in Figure 5, data center and tower REITs rank as the most essential businesses we have evaluated thus far. We believe the market has correctly ascribed high multiples to their cash flows given the long runway for future growth as well as the durability of current cash flows. We have continued to use pullbacks as opportunities to add to such great businesses with long term secular demand drivers, which more than offsets the elevated current valuation multiples.
[1] Source: FTSE, Bloomberg.
Richard J. Pickert, CFA
rpickert@chiltonreit.com
(713) 243-3211
Matthew R. Werner, CFA
mwerner@chiltonreit.com
(713) 243-3234
Bruce G. Garrison, CFA
bgarrison@chiltonreit.com
(713) 243-3233
RMS: 2039 (7.31.2020) vs 2402 (12.31.2019) vs 346 (3.6.2009) and 1330 (2.7.2007)RMS: 2039 (7.31.2020) vs 2402 (12.31.2019) vs 346 (3.6.2009) and 1330 (2.7.2007)
Previous editions of the Chilton Capital REIT Outlook are available at www.chiltonreit.com/category/library/reit-outlook/.
An investment cannot be made directly in an index. The funds consist of securities which vary significantly from those in the benchmark indexes listed above and performance calculation methods may not be entirely comparable. Accordingly, comparing results shown to those of such indexes may be of limited use.
The information contained herein should be considered to be current only as of the date indicated, and we do not undertake any obligation to update the information contained herein in light of later circumstances or events. This publication may contain forward looking statements and projections that are based on the current beliefs and assumptions of Chilton Capital Management and on information currently available that we believe to be reasonable, however, such statements necessarily involve risks, uncertainties and assumptions, and prospective investors may not put undue reliance on any of these statements. This communication is provided for informational purposes only and does not constitute an offer or a solicitation to buy, hold, or sell an interest in any Chilton investment or any other security.
for more info on our strategy
go now →
for more info on our strategy
go now →
VIEW CHILTON'S LATEST
Media Features
go now →
Contact Us
READ THE LATEST
REIT Outlook
go now →
disclaimers
terms & conditions & FORM ADV
SITE CREDIT
Navigate
HOME
TEAM
REITS 101
Approach
OUTLOOKS
media
Contact
back to top
VISIT CHILTON CAPITAL MANAGEMENT
This property and any marketing on the property are provided by Chilton Capital Management, LLC and their affiliates (together, "Chilton"). Investment advisory services are provided by Chilton, an investment adviser registered with the SEC. Please be aware that registration with the SEC does not in any way constitute an endorsement by the SEC of an investment adviser’s skill or expertise. Further, registration does not imply or guarantee that a registered adviser has achieved a certain level of skill, competency, sophistication, expertise or training in providing advisory services to its advisory clients. Please consider your objectives before investing. A diversified portfolio does not ensure a profit or protect against a loss. Past performance does not guarantee future results. Investment outcomes, simulations, and projections are forward-looking statements and hypothetical in nature. Neither this website nor any of its contents shall constitute an offer, solicitation, or advice to buy or sell securities in any jurisdictions where Chilton is not registered. Any information provided prior to opening an advisory account is on the basis that it will not constitute investment advice and that we are not a fiduciary to any person by reason of providing such information. Any descriptions involving investment process, portfolio construction or characteristics, investment strategies, research methodology or analysis, statistical analysis, goals, risk management are preliminary, provided for illustration purposes only, and are not complete and will not apply in all situations. The content herein may be changed at any time in our discretion . Performance targets or objectives should not be relied upon as an indication of actual or projected future performance. Investment products and investments in securities are: NOT FDIC INSURED • NOT A DEPOSIT OR OTHER OBLIGATION OF,OR GUARANTEED BY A BANK • SUBJECT TO INVESTMENT RISKS, INCLUDING POSSIBLE LOSS OF THE PRINCIPAL AMOUNT INVESTED. Investing in securities involves risks, and there is always the potential of losing money when you invest in securities including possible loss of the principal amount invested. Before investing, consider your investment objectives and our fees and expenses. Our advisory services are designed to assist clients in achieving discrete financial goals. They are not intended to provide tax advice, nor financial planning with respect to every aspect of a client’s financial situation, and do not incorporate specific investments that clients hold elsewhere. Prospective and current clients should consult their own tax and legal advisers and financial planners. For more details, see links below to CRS (Part 3 of Form ADV) for natural person clients; Part 2A and 2B of Form ADV for all clients regarding important disclosures.