REITs are Ripe for Active Management | February 2022
April 25, 2022
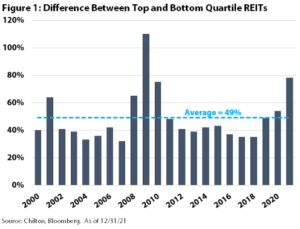
In this publication, we look back on 2021 and explain how our process resulted in several changes in the composition of client portfolios. While the REIT volatility in 2021 was nowhere near where it was in 2020, the dispersion of performance between the top and bottom quartile REITs was elevated at 78 percentage points, which compares to the 10 year average of 49 percentage points. Dispersion such as this usually makes for a fertile ground for active management, but interestingly only 32% of mutual funds in the real estate category on Morningstar outperformed their respective benchmarks in 2021, meaning 68% of managers underperformed. Though it produced a total return of +41.5% gross of fees (+40.5% net of fees), the Chilton Capital REIT Strategy also underperformed the MSCI US REIT Index (Bloomberg: RMZ) at +43.1%, as most of the drivers for the strategy’s outperformance in 2020 became the biggest detractors in 2021. However, since inception in January 2005, the Chilton Capital REIT Strategy has produced an annualized total return of +11.5% gross of fees (+10.6% net of fees), which compares to the RMZ at +8.7%.
As we recognized that the economy was on good footing and interest rates had upward pressure, we began to reduce exposure from the ‘COVID’ REITs (ones that were not impacted or even benefited from COVID) and into the ‘vaccine’ REITs (those that were hurt by COVID and benefited from the reopening). We made several moves that helped narrow the relative performance in 2021 and prepare the portfolios for 2022. Already, the market pullback in January of -6.9% in the RMZ has created further opportunities to take advantage of mispricing in the public market, according to our analysis.
As a reminder, we believe that calendar year 2022 will produce a total return in the range of +5% to +10% as we outlined in our ‘2022 Chilton REIT Forecast’ published on January 3, 2022. Thus, from the prices on January 31, 2022, the total return for the remainder of the year would need to be +12% to +17% to reach our forecast.
2021 Review
As shown in Figure 1, the difference between the top quartile performing REITs and the bottom quartile performing REITs was over 78 percentage points in 2021. To be exact, the best performing REITs had an average total return of +75%, while the worst performing REITs had an average total return of -3%. As active managers, we can add alpha (outperformance versus the benchmark) by overweighting the top performing REITs or underweighting the underperforming REITs (or both!).
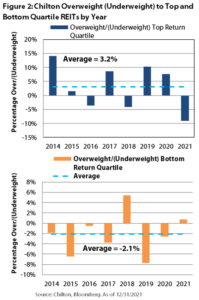
As shown in Figure 2, we have historically been able to avoid the underperforming names and have a strong track record of both overweighting the top performing REITs and underweighting the underperforming REITs. Surprisingly, in 2021 we had an overweight to the underperforming REITs and an underweight to the top-performing REITs but were able to produce gross of fee performance within 160 bps of the benchmark due to moves made during the year and the stocks owned (and not owned) within the middle two quartiles.
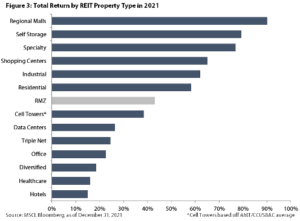
As one would expect, the difference in performance between property types was extreme in 2021 (see Figure 3). We attribute the differences between stocks and property types to the upheaval caused by COVID in 2020, which created winners and losers. The top three performing property types were regional malls, self storage, and specialty. In contrast, the bottom three were healthcare, hotels, and diversified. Unfortunately, we had overweight allocations to the healthcare and diversified sectors and underweights to all three of the top performing sectors. Therefore, sector allocation was a detractor of relative total returns for the Chilton REIT Strategy in 2021.
However, our bottom-up stock selection process was almost able to make up for the negative attribution from sector allocation. In particular, stock selection in the diversified sector was extremely strong partly due to two new positions that were added in 2021, American Assets Trust (NYSE: AAT) and Armada Hoffler (NYSE: AHH).
In fact, we made over 20 trades in 2021, including new buys, sells, trims, and adds, in addition to reinvesting dividends. In total, we added seven new positions to the portfolio, and sold out of five positions.
Low portfolio turnover is a key tenet to how we manage portfolios as it helps to minimize taxable events and transaction fees. ‘Portfolio turnover’ essentially measures how much of the portfolio was traded during the year. In general, we strive to maintain turnover in the range of 25-30% over the long term. In 2021, we had turnover of 29.2%, which compares to the 2013-2020 average of 28.3%.
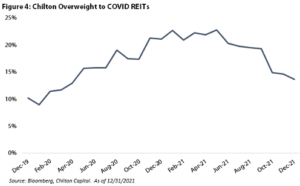
As we stated in our January 2021 REIT Outlook titled ‘2021 Chilton REIT Forecast’, we planned to add exposure to the vaccine REITs and decrease exposure to the COVID REITs that had helped us to produce 470 basis points (or bps) of outperformance gross of fees (+390 bps net of fees) versus the benchmark in 2020. As shown in Figure 4, our overweight to the COVID REITs decreased from over 20% down to 14% by 2021 year end due to the moves we made during the year. In fact, when taking out cell towers (a core holding), the strategy was overweight vaccine REITs as of December 31, 2021!
Positioning for 2022
There are several themes that we have been playing in the portfolio over the past year, and we continue to find undervalued REITs that provide exposure to them.
First, we believe that work from home (or WFH) and work from anywhere (or WFA) will have a permanent drag on office demand, particularly in the coastal urban markets such as New York City and San Francisco. According to WFH Research, approximately 30% of workers will have hybrid working arrangements post-COVID, and 15% of jobs will be fully remote. Companies will use that as a reason to decrease the space they rent, which will prevent many landlords from having pricing power to increase rents. In addition, the migration to Sunbelt cities will increase the uncertainty of long term demand in New York and San Francisco, which should decrease valuations. We believe there is more pain to be felt from these changing trends, as many companies have renewed leases on a short term basis while they figure out long term solutions. One prominent statistic is the growing amount of sub-lease space on the market that recently stood at over 150 million square feet (or sqft) nationwide as of December 31, 2021. This compares to the high in 2009 of less than 80 million sqft! In San Francisco, approximately 9% of the office market is available for sublease! As such, we do not own any coastal office REITs; in contrast, the only focused office REIT in the portfolio is Cousins Properties (NYSE: CUZ), the largest landlord in Austin, Tempe, Atlanta, Tampa, and Charlotte. Though employees in these cities may have the same WFH desires, the net in-migration to these cities due to multiple new employers desiring cheaper alternatives should provide enough demand to maintain occupancy and produce rent growth.
Another theme is the undersupply of housing, particularly single family homes. In the years between 1992 and 2007, the country started construction on an average of 1.3 million single family homes per year. However, from 2009-2021, the US averaged only 700,000 new homes per year. At the same time, household formation averaged 1.1 million per year from 2009-2020. To fill the gap, new households have had to move into apartments, manufactured homes, recreational vehicle (or RV) parks, and single family rental (or SFR) homes. With mortgage rates potentially on the rise, buying a home may become more difficult for some. Furthermore, we don’t see the undersupply situation improving any time soon given rising construction costs (up to 10% per year!) and reduction in the availability of labor. As such, the Chilton REIT Composite has an overweight allocation to all of the above solutions to the housing crisis in the country, in addition to a student housing REIT in the residential sector.
The need for warehouse space to accommodate growing e-commerce business, and even merely to support the brick and mortar real estate has created a fertile ground for rent growth, and especially development profits. While rising construction costs have caused development yields to fall to record lows for industrial giant Prologis (NYSE: PLD), profit margins are near all-time highs due to falling cap rates (the inverse of a multiple; lower cap rate = higher valuation). Cap rates are now easily below 4% for a quality location with a credit tenant. In 2021 alone, PLD created $1.3 billion in value from development at a 53% profit margin (both record highs). The value creation equates to $1.71 per share, which compares to PLD’s closing price of $156.82 per share on January 31, 2022. According to PLD CEO Hamid Moghadam, tenant inventories are about 10% below pre-COVID levels, while they would like to get to inventory levels that are 10% above pre-COVID. That would equate to the need for 20-25% more space that they currently have today. In addition, Mr. Moghadam stated that their tenant rent levels are on average 36% below market. If they could hypothetically get all tenants to market rent levels immediately, it would result in $1.2 billion more in annual net operating income, or $1.55 per share. This compares to 2021’s actual funds from operations per share of $4.15.
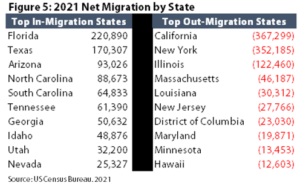
Finally, we believe the migration away from expensive coastal cities will continue, though at a slower rate than what happened in 2020 and 2021. As shown in Figure 5, the migration into states such as Florida, Texas, and Arizona has been staggering, especially when compared to the outmigration away from New York, California, and Illinois. The warmer weather, cheaper cost of living, and higher quality of life has become possible for more people thanks to the advent of technology allowing for work from anywhere. Our portfolio has overweights to the Sunbelt within office, apartments, single family rentals, and shopping centers. Though the ‘secret’s out’ about the Sunbelt, we believe this trend will continue, benefiting almost all property types in these locations.
ESG and Diversity at Chilton
Though it’s not an explicit part of the stock selection process, the Chilton REIT Team prides itself on being a leader with ‘best practices’. Recently, we have begun updating due diligence questionnaires for the investment platforms we serve with an extra section on Diversity and Inclusion. In addition, we felt it is a good time to educate our clients on the efforts made by the National Association of REITs (or NAREIT), the trade group that represents all companies in our portfolios, to fully embrace ESG (Environmental, Social, Governance) and Diversity. ESG ratings have grown increasingly important to investors and other constituencies over the past few years and the REIT sector has not been unique in rising to the challenge. NAREIT only published its inaugural ESG report back in 2018, but since then adoption across the group has been tremendous.
Within our portfolio, nearly 90% of companies published a 2020 Sustainability Report, and we expect that number to push closer to 100% over the next year or two based on management commentary. NAREIT further reports that of REITs reporting to GRESB (Global Real Estate Sustainability Benchmark), carbon emissions fell 5% in 2020 (equivalent to the lifetime emissions of nearly 91,000 automobiles). REITs have embraced environmental performance disclosure to also include energy and water usage as well as waste management disclosures. 99 of the largest REITs (by market capitalization) have at least one female board member and female members comprised over 24% of available board seats last year.
While all REITs have been leaders worldwide in ESG efforts, there will likely become a time when those with the best ESG practices are able to attract the most tenants at the highest rent, and therefore should deserve the highest multiple. One such example was recently noted by one of the leading office REITs that had a tenant request for a “net-zero” option before consummating a lease. We also note that feedback from landlords confirm that tenants are looking for the newest, most modern space available. Accordingly, since REITs tend to own the best properties, we are watching these trends closely.
We will continue to monitor the market for changes to our current themes, and of course looking for new ideas. With the market pulling back -6.9% in January 2022 (and some REITs over 15%!), we are already seeing opportunities to take advantage of mispricing within property types and individual securities.
Matthew R. Werner, CFA
mwerner@chiltoncapital.com
(713) 243- 3234
Bruce G. Garrison, CFA
bgarrison@chiltoncapital.com
(713) 243-3233
Thomas P. Murphy, CFA
tmurphy@chiltoncapital.com
(713) 243-3211
RMS: 2,956 (1.31.2022) vs. 3,177 (12.31.2021) vs 1,433 (3.23.2020) and 2,560 (2.21.2020)
An investment cannot be made directly in an index. The funds consist of securities which vary significantly from those in the benchmark indexes listed above and performance calculation methods may not be entirely comparable. Accordingly, comparing results shown to those of such indexes may be of limited use.)
The information contained herein should be considered to be current only as of the date indicated, and we do not undertake any obligation to update the information contained herein in light of later circumstances or events. This publication may contain forward looking statements and projections that are based on the current beliefs and assumptions of Chilton Capital Management and on information currently available that we believe to be reasonable, however, such statements necessarily involve risks, uncertainties and
assumptions, and prospective investors may not put undue reliance on any of these statements. This communication is provided for informational purposes only and does not constitute an offer or a solicitation to buy, hold, or sell an interest in any Chilton investment or any other security. Past performance does not guarantee future results.
Leave a Reply Cancel reply
for more info on our strategy
go now →
for more info on our strategy
go now →
VIEW CHILTON'S LATEST
Media Features
go now →
Contact Us
READ THE LATEST
REIT Outlook
go now →
disclaimers
terms & conditions & FORM ADV
SITE CREDIT
Navigate
HOME
TEAM
REITS 101
Approach
OUTLOOKS
media
Contact
back to top
VISIT CHILTON CAPITAL MANAGEMENT
This property and any marketing on the property are provided by Chilton Capital Management, LLC and their affiliates (together, "Chilton"). Investment advisory services are provided by Chilton, an investment adviser registered with the SEC. Please be aware that registration with the SEC does not in any way constitute an endorsement by the SEC of an investment adviser’s skill or expertise. Further, registration does not imply or guarantee that a registered adviser has achieved a certain level of skill, competency, sophistication, expertise or training in providing advisory services to its advisory clients. Please consider your objectives before investing. A diversified portfolio does not ensure a profit or protect against a loss. Past performance does not guarantee future results. Investment outcomes, simulations, and projections are forward-looking statements and hypothetical in nature. Neither this website nor any of its contents shall constitute an offer, solicitation, or advice to buy or sell securities in any jurisdictions where Chilton is not registered. Any information provided prior to opening an advisory account is on the basis that it will not constitute investment advice and that we are not a fiduciary to any person by reason of providing such information. Any descriptions involving investment process, portfolio construction or characteristics, investment strategies, research methodology or analysis, statistical analysis, goals, risk management are preliminary, provided for illustration purposes only, and are not complete and will not apply in all situations. The content herein may be changed at any time in our discretion . Performance targets or objectives should not be relied upon as an indication of actual or projected future performance. Investment products and investments in securities are: NOT FDIC INSURED • NOT A DEPOSIT OR OTHER OBLIGATION OF,OR GUARANTEED BY A BANK • SUBJECT TO INVESTMENT RISKS, INCLUDING POSSIBLE LOSS OF THE PRINCIPAL AMOUNT INVESTED. Investing in securities involves risks, and there is always the potential of losing money when you invest in securities including possible loss of the principal amount invested. Before investing, consider your investment objectives and our fees and expenses. Our advisory services are designed to assist clients in achieving discrete financial goals. They are not intended to provide tax advice, nor financial planning with respect to every aspect of a client’s financial situation, and do not incorporate specific investments that clients hold elsewhere. Prospective and current clients should consult their own tax and legal advisers and financial planners. For more details, see links below to CRS (Part 3 of Form ADV) for natural person clients; Part 2A and 2B of Form ADV for all clients regarding important disclosures.