Equity REITs: Ready to Flex on Uncertainty | March 2022
April 25, 2022
Years ago, the market had adages such as “when the shoeshine boy talks stocks” or “taxi drivers telling you what to buy” to serve as warnings for market tops. Widespread equity interest was certainly one of the themes of the pandemic, but, as we turn to 2022, it feels like retail sentiment has shifted from unbridled optimism for “reddit stocks” to widespread fear around rising interest rates and inflation. Case in point, over the last month I’ve fielded Fed policy queries from Uber drivers, friends, and my parents. Recall, as recently as the June 2021, less than half of the Federal Reserve members were projecting even a single rate hike for 2022. With inflation surging through the end of 2021, most were projecting three hikes in 2022 with the first occurring in March (as of the January Fed meeting minutes released on February 16th).
So is there a call to be made from these passing conversations? Probably not, other than uncertainty is elevated and likely remains so. Amidst uncertainty, we can construct a portfolio built to weather a range of outcomes. As such, we believe an actively managed portfolio of REITs presents the perfect weapon to battle rising inflation and interest rate uncertainty. We see three key factors in today’s market which position REITs exceptionally well for rising rates: 1) REITs are producing more internally generated cash flow than any time in history (e.g., cash left over after paying dividends) allowing them to raise dividends or fund projects without tapping capital markets, 2) REITs employ robust balance sheets with the longest weighted average maturities in their history, and, finally, 3) many REIT property types act as an inherent hedge to rising inflation. If we boil these three factors down into one word, it all comes down to flexibility. When facing uncertainty, the more flexible company wins, and thankfully, we believe that REITs have flexibility in spades.
Rate Review
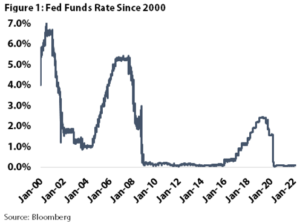
Shown in Figure 1, the Fed Funds Rate (the interest rate that depository institutions use to trade federal funds overnight) has been held near zero since the onset of the pandemic. While the Fed Funds Rate has not been hiked since being slashed to zero in March 2020, the 10 year Treasury yield has certainly started to react as the Fed’s commentary turned increasingly hawkish in the latter parts of 2021. Indeed, as of the December 2021 meeting, every single member expected at least one hike, with most expecting three hikes in 2022 and for the first hike to be in March. This shift in thinking has only gained momentum in 2022, with some investors even anticipating an emergency 50bps hike before the March meeting!
Inflation Rearing its Ugly Head
One of the primary drivers behind the shift in rate hike expectations has been persistent inflation due to the trillions of COVID relief funds doled out to a vast percentage of the US population. This has resulted in consumer balance sheets having record net worth and money to spend. In many cases, the largesse was so plentiful as to keep workers from returning to their jobs. As a result, employers have experienced a shortage of labor across a wide swath of the economy, resulting in higher wages for almost everyone. Language around inflation began to soften in the September minutes, but the Fed formally nixed “transitory” in December following the 6.8% CPI (Consumer Price Index) increase for November. Inflation has only accelerated with +7.0% in December and +7.5% in January!
What about the 10 Year Treasury Yield?
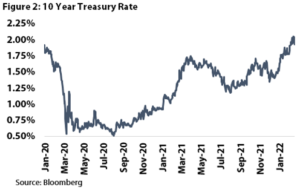
As shown in Figure 2, the 10 year Treasury yield has moved materially off its lows from the early pandemic days. Recall, the 10 year Treasury yield fell to nearly 0.5% in March 2020 and remained below 1% until early 2021. While we saw modest increases through the majority of 2021, those increases started in earnest these past few months as the market began to bake in several hikes in 2022 as well as Fed tapering plans. Notably, the 10 year Treasury yield briefly ticked above 2% in early February for the first time since July of 2019.
How are REITs Impacted?
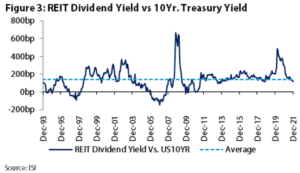
In general, investors tend to hold a rather simplistic view that higher interest rates mean higher dividend yields, which would result in lower equity values. While there is some correlation data to support this notion, the relationship is not as strong as one might expect and there are a lot more factors to take into account. The spread between the REIT dividend yield and Treasury yield is constantly fluctuating, but averaged about 137 basis points over the past 30 years. If it was a perfect relationship, the spread would not fluctuate nearly as much as is shown in Figure 3. As such, interest rates could rise in tandem with the spread compressing and the ultimate impact to values could be nothing. Recent property transactions have yet to reflect any decline in values and some property types have even witnessed increases.
Shown in Figure 3, the spread between REIT yields and the 10 year had compressed to 119 bps as the 10 year approached 2% as of the end of January. This compares to early pandemic peaks in the 300-400bps range (when the 10 year dipped below 1%) and the long term average of 137 bps, which would indicate that REITs that are not in the bargain territory.
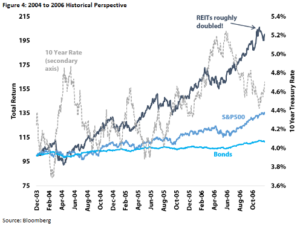
However, we see several reasons why REITs could still outperform. First, let’s take a look at some historical examples. Although REITs have historically underperformed the S&P 500 during periods of rising interest rates, the group meaningfully outperforms the S&P in the periods following rising rates. Since we do not have a crystal ball predicting Fed policy, we urge investors not to miss the forest for the trees. For a more specific and recent example, Figure 4 shows the 2004-2006 interest rate hike cycle. The Fed hiked interest rates a total of 17 times during those years, pushing the 10 year yield from a low ~4% to over 5% in early 2006. As one can see, REITs took a ~15% dip during the initial spike in the 10 year yield, but REITs outperformed the S&P 500 massively over the entire period. In our view, a two-year ~200% total return for REITs is much more important than a ~15% correction.
Adding to that historical upside, there are several more important distinctions within the REIT universe today that position the group better than prior periods. Indeed, retained cash is materially elevated, dividend growth is set to outpace inflation for several years, many REITs are able to increase rents alongside inflation, and finally, debt metrics are near the most attractive levels in REIT history. All told, we believe REITs have afforded themselves flexibility to outperform in a multitude of macro scenarios. With that said, all REITs are not created equally, and the spread between the “haves” and “have nots” could grow even wider than normal. Therefore, in uncertain macro times, active management becomes even more important as attractively positioned REITs should meaningfully outperform the index.
Retained Cash Insulates REITs
It is a common misconception that Equity REITs must pay out all the cash they generate. The actual mandate is to distribute 90% of taxable net income. The major difference is that the depreciation expense lowers taxable income but is a non-cash charge. This distinction is very important because it means REITs are able to retain cash to be reinvested in the business. This reinvestment process translates into an average internal growth rate of 1-2%. We calculate REITs’ dividend payout ratio based off of Adjusted Funds from Operations (AFFO = normalized FFO after deducting spending on capital improvements), and this measure is currently at its lowest level in history! As shown in Figure 5, REITs historically paid out ~79% but are only paying out a record low 69% of AFFO as of 3Q21. Said a different way, 31% of every dollar generated remains on the balance sheet to fund future growth projects, retire debt, or grow dividends.
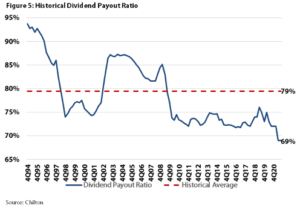
This exceptionally low payout level affords several options to REIT management teams. First, as we mentioned in our annual forecast from January 2022, it provides ample room to increase dividends. However, for REITs with strong growth prospects, internally generated cash flow provides an extremely attractive source of capital funding. In particular, as rates increase, retained cash will help insulate REITs from capital market headwinds. Some REITs can use this free cash flow to become aggressive and take advantage of dislocation by owners that may not enjoy the same cushion.
Exceptional Dividend Growth Outlook
Just as one would expect a stock with stronger growth prospects to trade at a higher multiple than one with weaker growth, the REIT spread to the 10 year has to account for the dividend growth outlook. Fortunately today, the outlook for REIT dividend growth is exceptional! We forecast strong cash flow growth and the aforementioned record low payout ratio driving well above average dividend growth for several years to come. Within our portfolio, we forecast a nearly 10% increase for 2022 on a weighted average basis, with high single digit increases holding for several years. Even in today’s high inflation environment, we see REITs growing dividend payments at a much quicker pace than inflation over the long term.
REITs as an Inflation Hedge
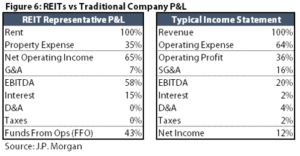
During periods of elevated inflation, conventional wisdom points investors toward real assets. Real estate is a prime example as owners are able to pass on higher costs in the form of increased rent. Additionally, Figure 6 compares a representative income statement for a typical REIT and an average S&P 500 company. As one can see the cost structure for the typical REIT is far less exposed to inflation (no cost of goods sold, less employees, etc.). Further, REITs with relatively short lease terms (self-storage, hotels, apartments, etc.) or contracts with inflation linked escalators should be able to keep increasing rents in line with inflation. With that said, not all REITs retain the same exposure to inflationary pressures, which brings us back to the importance of active management in uncertain times.
Strongest Balance Sheets in REIT History
REITs used attractive debt costs and robust business models to meaningfully improve balance sheets during the pandemic. Specifically, net debt to EBITDA declined tremendously in recent quarters, falling below 5x as of year-end (vs the long term average of 6.2x). At the same time weighted average maturities increased from ~5 years to closer to 9 years.
REITs Flexibility is the Ultimate Weapon
The major risk for all investors in equities is that the Fed has no playbook for easily navigating us out of the inflation mess. Engineered recessions have been a popular strategy to kill rampant inflation in the past. And, we are hearing increasing chatter about that very possibility in 2023. As we’ve stated ad nauseam, flexibility and optionality reign supreme in times of uncertainty, and REITs have successfully filled their quivers with both offensive and defensive arrows throughout the pandemic. Robust balance sheets, elevated retained cash flow, and low dividend payout ratios afford management teams a multitude of options for any macro factor they face. If interest rates rise, REITs can fund projects with retained cash flow or equity. This optionality inspires extreme conviction in our outlook for elevated dividend growth, even amidst a challenging macro backdrop.
Thomas P. Murphy, CFA
tmurphy@chiltoncapital.com
(713) 243-3211
Matthew R. Werner, CFA
mwerner@chiltoncapital.com
(713) 243- 3234
Bruce G. Garrison, CFA
bgarrison@chiltoncapital.com
(713) 243-3233
RMS: 2,862 (2.28.2022) vs. 3,177 (12.31.2021) vs 1,433 (3.23.2020) and 2,560 (2.21.2020)
An investment cannot be made directly in an index. The funds consist of securities which vary significantly from those in the benchmark indexes listed above and performance calculation methods may not be entirely comparable. Accordingly, comparing results shown to those of such indexes may be of limited use.)
The information contained herein should be considered to be current only as of the date indicated, and we do not undertake any obligation to update the information contained herein in light of later circumstances or events. This publication may contain forward looking statements and projections that are based on the current beliefs and assumptions of Chilton Capital Management and on information currently available that we believe to be reasonable, however, such statements necessarily involve risks, uncertainties and
assumptions, and prospective investors may not put undue reliance on any of these statements. This communication is provided for informational purposes only and does not constitute an offer or a solicitation to buy, hold, or sell an interest in any Chilton investment or any other security. Past performance does not guarantee future results.
Leave a Reply Cancel reply
for more info on our strategy
go now →
for more info on our strategy
go now →
VIEW CHILTON'S LATEST
Media Features
go now →
Contact Us
READ THE LATEST
REIT Outlook
go now →
disclaimers
terms & conditions & FORM ADV
SITE CREDIT
Navigate
HOME
TEAM
REITS 101
Approach
OUTLOOKS
media
Contact
back to top
VISIT CHILTON CAPITAL MANAGEMENT
This property and any marketing on the property are provided by Chilton Capital Management, LLC and their affiliates (together, "Chilton"). Investment advisory services are provided by Chilton, an investment adviser registered with the SEC. Please be aware that registration with the SEC does not in any way constitute an endorsement by the SEC of an investment adviser’s skill or expertise. Further, registration does not imply or guarantee that a registered adviser has achieved a certain level of skill, competency, sophistication, expertise or training in providing advisory services to its advisory clients. Please consider your objectives before investing. A diversified portfolio does not ensure a profit or protect against a loss. Past performance does not guarantee future results. Investment outcomes, simulations, and projections are forward-looking statements and hypothetical in nature. Neither this website nor any of its contents shall constitute an offer, solicitation, or advice to buy or sell securities in any jurisdictions where Chilton is not registered. Any information provided prior to opening an advisory account is on the basis that it will not constitute investment advice and that we are not a fiduciary to any person by reason of providing such information. Any descriptions involving investment process, portfolio construction or characteristics, investment strategies, research methodology or analysis, statistical analysis, goals, risk management are preliminary, provided for illustration purposes only, and are not complete and will not apply in all situations. The content herein may be changed at any time in our discretion . Performance targets or objectives should not be relied upon as an indication of actual or projected future performance. Investment products and investments in securities are: NOT FDIC INSURED • NOT A DEPOSIT OR OTHER OBLIGATION OF,OR GUARANTEED BY A BANK • SUBJECT TO INVESTMENT RISKS, INCLUDING POSSIBLE LOSS OF THE PRINCIPAL AMOUNT INVESTED. Investing in securities involves risks, and there is always the potential of losing money when you invest in securities including possible loss of the principal amount invested. Before investing, consider your investment objectives and our fees and expenses. Our advisory services are designed to assist clients in achieving discrete financial goals. They are not intended to provide tax advice, nor financial planning with respect to every aspect of a client’s financial situation, and do not incorporate specific investments that clients hold elsewhere. Prospective and current clients should consult their own tax and legal advisers and financial planners. For more details, see links below to CRS (Part 3 of Form ADV) for natural person clients; Part 2A and 2B of Form ADV for all clients regarding important disclosures.