Retail REITs: Revisited and Reconsidered | November 2021
November 1, 2021
It has been exactly one year since we published ‘Essential REIT Evaluation: Retail’, and, looking back on the piece, one could describe it as overly cautious and concerned with the longer term impact of the pandemic on this sector. However, hindsight is 20/20, and we were working with much different information a year ago.
Just a little over a week after we published, Pfizer announced the success of its BioNTech COVID vaccine, which set into motion a reversion to the mean for all REITs that had underperformed, and reversed much of the gains of those that had outperformed. In the 12 months ending October 31, 2021, the Bloomberg Regional Mall REIT Index (Bloomberg: BBREMALL) produced a total return of +141% and the Bloomberg Shopping Center REIT Index (Bloomberg: BBRESHOP) produced a total return of +109%. These compared to +52% for the MSCI US REIT Index (Bloomberg: RMZ), and, as an example, +21% for the straight average of the cell tower REITs, the best performers for the 2020 year to date period ending October 31, 2020.
The strong retail REIT stock price performance reflects the investor optimism for occupancy gains, potential rent growth, and dividend growth that should outpace inflation. This is based on surprisingly strong foot traffic reports that show levels nearing 2019, which is encouraging for brick and mortar retailers that are looking to expand. In addition, the strong stock price appreciation for retailers has given them a green light to spend on brick and mortar in addition to e-commerce, which has led shopping center REITs to report “record high demand” for space.
There were many uncertainties a year ago, and we believe many of those remain unanswered today. Although the stock prices of many retail REITs are back above pre-COVID levels, earnings are far from it. In spite of the positive vaccine news and its wide availability in the US, the recent Delta variant and the politicized nature of the vaccine indicate that we will be dealing with COVID beyond 2021. Vaccine mandates in New York City have already decimated restaurant sales since going into effect on August 16th, and further vaccine mandates in other cities may be on the horizon. New York City and San Francisco office occupancy remain depressed at 31.8% and 25.4% respectively, as of October 20th. Labor shortages and supply chain issues have increased costs and decreased profit margins.
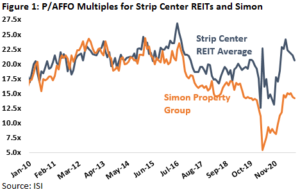
On a relative basis, malls and shopping centers are now trading at ~18x next 12 months AFFO as of October 31, 2021, which compares to the REIT average of ~24x, meaning expectations for growth are high. For context, if we look back into the depths of the pandemic, the combined retail group’s (strip + mall REITs) AFFO multiple troughed at ~8x in March 2020 and recently peaked in early summer just over 20x. However, the range has also been exceptionally wide with the most beaten down mall names drifting to low single digit multiples while more insulated strip centers REITs (e.g., grocery anchored) maintained AFFO multiples in the mid-teens through the pandemic. Highlighted in Figure 1 below, although the trajectory of recovery has been fairly similar, the gap between strip centers and malls (we use SPG as a proxy) has continued to grow through the pandemic. Importantly, AFFO multiples for shopping centers surpassed February 2020’s pre-COVID peak, and approached the 10 year high.

As such, while we have become more comfortable with the evidence that brick and mortar retail could return to pre-COVID levels sooner than we expected, we are still cautious on the sector as a whole, and more importantly, we do not think the recovery will be felt evenly. Therefore, we have used our bottom-up contrarian process to find ideas that will be able to participate in the reopening trade, but with less downside. We believe this discipline is what has allowed us to generate a long term track record of outperformance versus the MSCI US REIT Index, and will reward our clients again when investors focus on earnings growth after 2022.
State of the Retail Real Estate Industry
Starting on the first quarter 2021 earnings calls, multiple shopping center CEOs reported ‘record demand’, a surprising statement given that COVID cases had just peaked in January 2021. According to them, ‘demand’ was an interest in signing letters of intent, but may not necessarily result in lease signings and may not be at the rates we saw pre-COVID. However, it was definitely something that piqued our interest. As it turned out, 1Q21 was the bottom for shopping center occupancy, which ticked below 90% for the first time on record. The record demand bumped occupancy above 90% in 2Q21, and will likely follow a strong trajectory upward for several years.

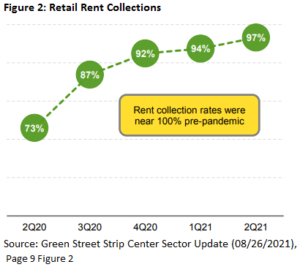
Rent collection of course bottomed in 2Q20 as many retailers either left or used stimulus money to resume paying rent. As of 2Q21, rent collection for shopping centers is back up to 97%, which compares to 2Q20’s print of 73% and the historical average of 100%, as shown in Figure 2. The remaining companies that are still struggling to pay rent are in the fitness and movie theater categories.
One of our concerns was the ability for rents to get back to pre-COVID given the amount of vacancy available (occupancy fell from 92% to below 90% for shopping centers). Amazingly, re-leasing spreads (the difference between the new or renewal rent versus the prior rent) have remained positive for shopping center REITs. There are nuances to the reported leasing spread numbers that make it difficult to know what’s happening across the whole portfolio, but the 2Q21 reported average leasing spread of +6% represents a meaningful improvement off 4Q20 (though spreads are still depressed from historical levels in the low double digits).
However, most retail REITs are not providing the full story on what it is costing to achieve the aforementioned rental gains, i.e., the capital expenditures required to attract/keep a tenant. In virtually all cases, REITs report what we consider the gross change in rents but conveniently leave out either leasing commissions, tenant improvements or the duration of the new lease. In addition, they are only able to report the spread achieved on ‘comparable’ leases, which may not include some of the most unfavorable leases signed. Only when you can evaluate all these inputs can one determine if there is an economic gain between the old rent and the new rent.
As with leasing spreads, there are many items that accounting can obscure from analysts, and even retailers can obscure from landlord. Thankfully, due to advances in technology and the ubiquity of smartphones, we now have the ability to track foot traffic with accuracy at shopping centers. We believe the surge in foot traffic from January 2021 to August 2021 in shopping centers and malls is painting a truly rosy picture for retail real estate. According to Placer.ai, the average shopping center had declines of 60% in foot traffic in March 2020, and Simon Property Group had a decline of almost 100%! After reopening, the declines versus 2019 leveled out around 20% for shopping centers and 30% for Simon from June 2020 through December 2020. However, from January 2021 to July 2021, the decline of 20% turned into an increase of 4% versus 2019 for shopping centers and a mere decline of 4% for Simon. We are watching this statistic closely, as a sustained recovery should translate to a return to 2019 revenue sooner than we anticipated. As it stands today, we believe rents will return to 2019 levels by 2024.
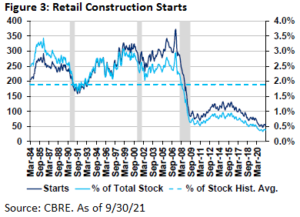
At the same time demand has been increasing, little to no new supply has entered the market. As shown in Figure 3, construction of new retail centers fell off of a cliff years ago and has not been keeping up with the average obsolescence rate of 1% since 2009. In fact, we believe the supply of retail real estate is shrinking, which is helping to drive the positive growth in occupancy and potentially rents.

From a pricing standpoint, we were very much in the dark as to where retail properties would trade until early 2021 when Kimco (NYSE: KIM) announced their merger with Weingarten (NYSE: WRI) at a high-5% cap rate on next 12 month net operating income (or NOI). That set in motion a flurry of transactions on the private market, and eventually led to yet another transaction whereby Kite Realty Group (NYSE: KRG) merged with RPAI (NYSE: RPAI) at a mid-6% cap rate. Cap rates for high quality grocery anchored centers drifted down into the low 5% range, eventually pulling down cap rates for even power centers and lifestyle centers. As such, it has been largely a ‘beta’ move in shopping center REITs, where they have all benefited from the exuberance about the near term growth in NOI.
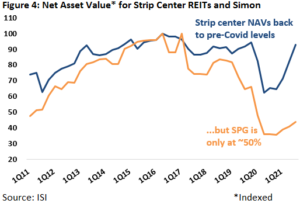
As of October 31, 2021, shopping center REITs are back to almost trading in line with sharply higher net asset values (or NAV), which represents the liquidation value of a REIT’s properties on the private market. The improvement reflects investor optimism of rising NAVs from higher NOI and potentially accretive acquisitions. We believe this may not be warranted given that NAVs may be shrinking if cap rates normalize at a higher level and NOI growth doesn’t achieve the high expectations set by the public market. However, NAV premium doesn’t tell the whole story as NAV is impacted by a myriad of factors (cap rate, etc.). As shown in Figure 4, absolute strip center NAVs have rebounded sharply, recently reaching pre-COVID highs as opposed to mall REITs (we use SPG as a proxy) where NAVs remain down ~50% from late 2019.

New Position – InvenTrust Properties
Looking at today’s retail landscape, we are most drawn to grocery-anchored (or at least “necessity based” power) centers geographically exposed to the growing regions of the country (namely the Sun Belt). These factors, alongside an attractive current valuation, are what we see in InvenTrust (NYSE: IVT). As of 2Q21, IVT owned 65 retail properties, totaling 10.9 million sqft in gross leasable area (9.8 million GLA pro rata to IVT). The portfolio is heavily weighted towards the Sun Belt (representing 90% of NOI) with Austin, Southern California, Atlanta, Miami and Dallas representing IVT’s top five markets by percentage of NOI. The company traces its inception back to Inland American Real Estate Trust, a non-publicly traded REIT launched in 2005 that began trading through a tender offer launched on October 12th. According to our estimates, IVT trades at 18x 2022 AFFO as of October 28, 2021, which compares to the average shopping center REIT at ~22x 2022 AFFO.
Risks Aplenty
We see the current bottlenecks in the supply chain coupled with the computer chip shortage negatively impacting overall retail sales for the foreseeable future due to reduced supply of a wide range of products from cars to virtually all electronics. The well-publicized congestion at the Ports of Los Angeles and Long Beach is not an easy fix due to a combination of State and Federal regulations that are restricting a fast correction. In California, truckers that have an engine built before 2010 cannot even engage in business in the state. And, Federal regulations require truckers to be at least 21 years old to engage in interstate commerce and are limited in the hours they can operate on a daily basis. On top of that, COVID-related payments to individuals has resulted in a diminished workforce as many prefer to “stay at home” as prevailing wages have not increased sufficiently to attract workers back.
Additionally, the seeds of inflation have also recently been planted by well-meaning politicians by such actions as the crackdown on the use/supply of fossil fuels that has caused oil prices to double in the past year, in addition to fuel and natural gas. We do not see this abating anytime soon as US pursues an energy strategy that relies upon external sources to meet rising demand. Since most consumer goods are delivered using trucks, the “cost-push” type inflation appears to be here for the foreseeable future. Needless to say, as consumers spend more on essentials such as food and energy, living standards fall since there is less discretionary income left over. When we peruse current conditions in the economy, we see a combination of fiscal, regulatory, and tax overkill that also threatens to lower buying power for most of the population.
As such, we are not ready to invest in malls due to the elevated risks that abound. In spite of the risk, SPG has produced a total return of 100% year to date through October 31, 2021, and trades at a 2022 AFFO multiple of 15x. We could become more constructive on the sector if we see continued momentum on foot traffic, in-store retail sales, and more price discovery by long term investors. Thus far, SPG has been the sole buyer of class A malls.
It is difficult to bet against the US consumer, and many have paid the price by avoiding these stocks this year. We believe we are gaining adequate exposure to the consumer through our diversified REITs, industrial REITs, residential REITs, several niche triple net REITs, and our position in IVT.
Matthew R. Werner, CFA
mwerner@chiltoncapital.com
(713) 243-3234
Bruce G. Garrison, CFA
bgarrison@chiltoncapital.com
(713) 243-3233
Thomas P. Murphy, CFA
tmurphy@chiltoncapital.com
(713) 243-3211
RMS: 2,942 (10.31.2021) vs 2220 (12.31.2020) vs 346 (3.6.2009) and 1330 (2.7.2007)
An investment cannot be made directly in an index. The funds consist of securities which vary significantly from those in the benchmark indexes listed above and performance calculation methods may not be entirely comparable. Accordingly, comparing results shown to those of such indexes may be of limited use.
The information contained herein should be considered to be current only as of the date indicated, and we do not undertake any obligation to update the information contained herein in light of later circumstances or events. This publication may contain forward looking statements and projections that are based on the current beliefs and assumptions of Chilton Capital Management and on information currently available that we believe to be reasonable, however, such statements necessarily involve risks, uncertainties and assumptions, and prospective investors may not put undue reliance on any of these statements. This communication is provided for informational purposes only and does not constitute an offer or a solicitation to buy, hold, or sell an interest in any Chilton investment or any other security. Past performance does not guarantee future results.
Leave a Reply Cancel reply
for more info on our strategy
go now →
for more info on our strategy
go now →
VIEW CHILTON'S LATEST
Media Features
go now →
Contact Us
READ THE LATEST
REIT Outlook
go now →
disclaimers
terms & conditions & FORM ADV
SITE CREDIT
Navigate
HOME
TEAM
REITS 101
Approach
OUTLOOKS
media
Contact
back to top
VISIT CHILTON CAPITAL MANAGEMENT
This property and any marketing on the property are provided by Chilton Capital Management, LLC and their affiliates (together, "Chilton"). Investment advisory services are provided by Chilton, an investment adviser registered with the SEC. Please be aware that registration with the SEC does not in any way constitute an endorsement by the SEC of an investment adviser’s skill or expertise. Further, registration does not imply or guarantee that a registered adviser has achieved a certain level of skill, competency, sophistication, expertise or training in providing advisory services to its advisory clients. Please consider your objectives before investing. A diversified portfolio does not ensure a profit or protect against a loss. Past performance does not guarantee future results. Investment outcomes, simulations, and projections are forward-looking statements and hypothetical in nature. Neither this website nor any of its contents shall constitute an offer, solicitation, or advice to buy or sell securities in any jurisdictions where Chilton is not registered. Any information provided prior to opening an advisory account is on the basis that it will not constitute investment advice and that we are not a fiduciary to any person by reason of providing such information. Any descriptions involving investment process, portfolio construction or characteristics, investment strategies, research methodology or analysis, statistical analysis, goals, risk management are preliminary, provided for illustration purposes only, and are not complete and will not apply in all situations. The content herein may be changed at any time in our discretion . Performance targets or objectives should not be relied upon as an indication of actual or projected future performance. Investment products and investments in securities are: NOT FDIC INSURED • NOT A DEPOSIT OR OTHER OBLIGATION OF,OR GUARANTEED BY A BANK • SUBJECT TO INVESTMENT RISKS, INCLUDING POSSIBLE LOSS OF THE PRINCIPAL AMOUNT INVESTED. Investing in securities involves risks, and there is always the potential of losing money when you invest in securities including possible loss of the principal amount invested. Before investing, consider your investment objectives and our fees and expenses. Our advisory services are designed to assist clients in achieving discrete financial goals. They are not intended to provide tax advice, nor financial planning with respect to every aspect of a client’s financial situation, and do not incorporate specific investments that clients hold elsewhere. Prospective and current clients should consult their own tax and legal advisers and financial planners. For more details, see links below to CRS (Part 3 of Form ADV) for natural person clients; Part 2A and 2B of Form ADV for all clients regarding important disclosures.