Self-Storage REITs: A Cautious Outlook for a COVID Winner | August 2023
August 1, 2023
Since the last Chilton REIT Outlook covering the self-storage sector was released in October 2020, “Essential REIT Evaluation: Self Storage”, the sector has grasped the attention of investors due to the unprecedented levels of demand and considerable outperformance through the pandemic. The sector has also been grabbing headlines recently due to the Extra Space (NYSE: EXR) and Life Storage merger and the Public Storage (NYSE: PSA) acquisition of Simply Self Storage. The ~$15 billion combined acquisitions by EXR and PSA have propelled the self-storage sector to the lead in 2023 deal-making as of July 31.
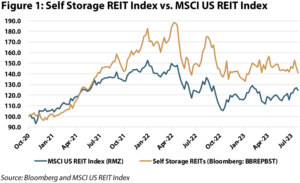
After record-level fundamentals in both 2021 and 2022, a return to normalcy seems evident thus far into 2023. As shown in Figure 1, the sector produced a total return of +79% in 2021 alone, the second highest of any property sector and ~3,600 basis points higher than the MSCI US REIT Index (Bloomberg: RMZ) for the year. However, in 2022, the total return of roughly -27% slightly underperformed the RMZ at -25%. Year to date as of July 31, 2023, the sector is up just over +4%, underperforming the RMZ by almost 400 basis points which we believe reflects the more competitive landscape ahead.
In the simplest terms, demand for self-storage is driven by the “5 D’s”. The 5 D’s include downsizing (lack of space at home or remodeling), divorce (or similar life events), death, dislocation, and the newest ‘D’, decluttering. Record low mortgage rates early in the pandemic brought elevated home sale activity and moves away from coastal urban cities. Furthermore, work-from-home resulted in scores of households suddenly looking to cram office space into their homes.
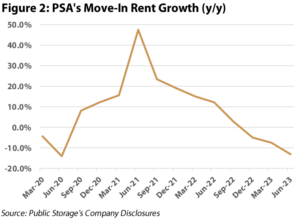
Both factors resulted in sky-high move-in rent growth of nearly 50% year-over-year at its peak as observed above in Figure 2. However, with mortgage rates having steadily risen over the past two years and more employees returning to the office, these two pieces of demand have declined in their significance and move-in rents have followed suit.
While the headline of dampening demand is undoubtedly pertinent and weighing on move-in rates, we believe these concerns can be somewhat mitigated given the following reasons:
-
- Supply over the next few years looks to be manageable.
-
- Existing Customer Rent Increases (ECRIs) look to become key drivers to revenue growth, supplanting declining move-in rates.
-
- Higher mortgage rates lower the ability to move into a larger space and hybrid / remote work arrangements have resulted in stickier customers leading to record-high customer length of stay.
The tailwinds are matched with additional headwinds of margin pressure, less earnings accretion from acquisitions, and an increasing interest rate environment.
In summary, we have a cautious view of self-storage given the risks to current and future operations, weighed against historically-attractive valuation metrics on a relative basis.
Supply Looks Benign
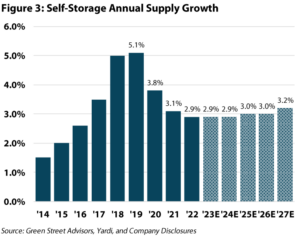
While new supply should be anticipated given the outsized same-store net operating income (SS NOI) growth in 2021 and 2022, developers have found it more difficult to get construction loans as of recent given tightened bank lending requirements amidst rising economic concerns. Additionally, new supply impact within self-storage is hyper-localized with the greatest effect felt within a 1-3 miles radius. Using supply data from Yardi Matrix and looking at all new facilities under construction, only ~24% of existing net rentable square feet from the five public self-storage REITs are expected to feel an impact from the construction getting delivered. As shown in Figure 3, the delivery expectations for the next five years are well below the 2017-2022 average of ~4.0%.
The Strategic Shift
Self-storage REITs have been implementing “Existing Customer Rent Increases”, or ECRIs, to a far greater extent as a key driver to revenue growth in the face of declining move-in rates. Longer average lease terms have allowed landlords to be more aggressive with rent increases.
Prior to the pandemic, ECRIs were typically sent out every 11-12 months and weren’t nearly as impactful to revenue growth. Now, however, ECRIs have become more substantial drivers to revenue growth with annualized ECRIs reaching over 20% at their peak in early 2022 and currently residing in the low-double digit range thus far in 2023. Supporting the effort are advanced revenue management algorithms that result in expedited revenue capture through ECRIs being sent out as frequently as every 4-6 months.
Sticky Customers
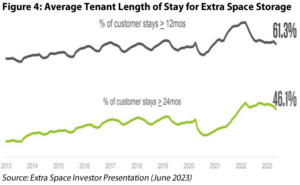
The recent shifts in demand drivers given hybrid / remote work and higher mortgage rates have led to record lengths of stay across self-storage REIT portfolios. As shown in Figure 4, Extra Space has increased its tenant’s average length of stay over the past 10 years and we expect for the trend to likely persist going forward.
In addition, public self-storage REITs have further differentiated themselves from smaller private operators through increased technological advancements. For example, PSA now executes ~60% of its move-ins through digital rental agreements and is able to offer dynamic pricing across its various channels. The scale of these REITs allows for superior digital customer experience and cost-effective asset management beyond the traditional operating model retained by many private owners.
We anticipate that the strategic shift, along with the factors mentioned above, should result in AFFO (or adjusted funds from operations, a measure of cash flow after maintenance capital expenditures) growth of +5% annually over the next two years across the sector on average. Occupancy of ~93% as of March 31, 2023, positive same-store revenue growth projections, impressive NOI (or net operating income) margins ranging from 73% to 79% across the sector, and low capital expenditure spend given the simplistic nature of the business contribute to the above-average AFFO growth projections.
Consolidation in a Fragmented Sector
While self-storage properties may seem ‘boring’, the self-storage REITs are extremely competitive. After beating out PSA to buy Life Storage, EXR has become the world’s largest self-storage operator with more than 3,500 stores serving millions of customers alongside becoming the 9th largest REIT included in the RMZ by equity market cap. The rationale behind the acquisition can be broken into four key factors:
-
- Better data and analytics given the increased customer base and scale allows for enhanced revenue management and trend observations.
-
- Significant synergy opportunities should create value through corporate overhead savings, better access to capital for future growth opportunities, and lower marketing spend given greater market density. EXR anticipates ~$100 million in annual operating synergies from the transaction.
-
- Enhanced diversification to expand geographic presence, quickly increasing exposure to desirable growth markets such as the Sun Belt.
-
- Despite EXR trading at a discount to its net asset value (NAV) when acquiring Life Storage, the deal is projected to be marginally accretive from an earnings and value perspective for EXR in our opinion.
Furthermore (and likely as a result of losing the bidding war for Life Storage), PSA announced on July 24, 2023, that it had agreed to acquire Simply Self Storage from Blackstone’s non-traded REIT (“BREIT”) for $2.2 billion. While it has been no secret that BREIT has had heightened liquidity needs to match recent redemption requests, the acquisition further showcases the ability for listed self-storage REITs to engage in a large transaction during a period of limited activity, ultimately taking advantage of accretive opportunities when smaller players are less able to do so.
PSA’s ability to execute its recent transaction at an accretive basis, despite trading at a discount to NAV, stems from its low leverage and adequate access to debt capital at favorable rates near ~5.3%. PSA is acquiring Simply Self Storage for 100% cash, sourcing the cash from the debt markets and not issuing a single share of equity. PSA expects to enhance operations and earnings through significant margin expansion given the 69% NOI margin for Simply Self-Storage versus PSA’s comparable NOI margin of 79%.
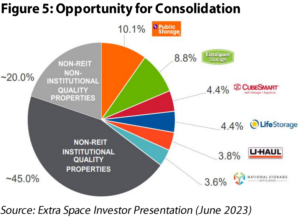
As highlighted in Figure 5, the self-storage sector remains a remarkably fragmented sector with a genuine need for consolidation to continue generating material synergies and assisting in the transformation of the sector.
Valuation Analysis
As of July 31, 2023, the average dividend yield of self-storage REITs was 4.5%, which compared to the REIT average of 3.9%. The low weighted average payout ratio on 2023 AFFO of 78% coupled with positive AFFO growth of +5% according to our analysis, should support increasing dividends going forward.
Self-storage REITs traded at ~17.5x expected 2023 AFFO as of July 31, 2023, which compares to the REIT average of ~20.1x as of the same time. Over the past 10 years however, self-storage REITs have, on average, traded at a ~2x AFFO multiple premium to the average REIT. The current discount seems about right given that the premium was earned in periods of superior AFFO growth compared with other REIT sectors. While earnings growth projections are still positive, the generalized concerns surrounding the sector justify the lack of a multiple premium to the average REIT.
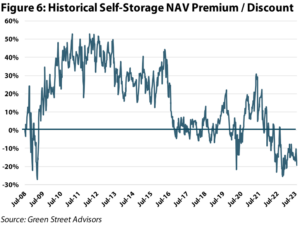
Finally, as presented in Figure 6, self-storage REITs are currently trading at an NAV discount of -19% as of July 31, 2023, well below the sector’s historical average NAV premium of +15%. While the steep discount to NAV makes external growth more difficult, we believe that well-capitalized REITs will still be able to make accretive acquisitions given their scale, access to capital, and track-record at executing synergies.
Chilton’s Self-Storage Position
As of July 31, 2023, the Chilton REIT Composite had an 8.2% allocation to the storage sector, which compares to the RMZ’s allocation of 8.6% as presented below in Figure 7. Our self-storage allocation is made up of both PSA (4.7% of the REIT composite) and EXR (3.5% of the REIT composite), following the completion of the EXR / Life Storage merger.
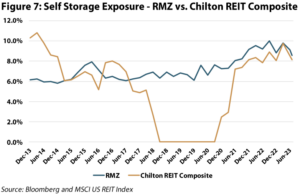
In spite of the underweight position as of July 31, the Chilton REIT Composite produced a 2023 YTD total return of +14.9% within the sector versus the Bloomberg Self Storage Index (Bloomberg: BBREPBST) total return of +4.4%. The overweight to Life Storage and lack of exposure to the worst performing self-storage REIT (Extra Space) were the main drivers of the outperformance.
A Cautious Outlook for Self Storage
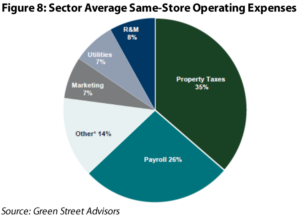
One of the main headwinds to margin expansion and earnings growth over the near-term remains heightened expense growth. In 2022, same-store expense growth was +6.8%, the sector’s highest ever. Unfortunately, 2023 is not projected to be better given higher labor costs, increased property taxes, soaring insurance costs, and a growing marketing spend. For context, as shown in Figure 8, property taxes and labor make up ~60% of total expenses for self-storage REITs, on average, for which we have yet to see relief.
Another notable headwind for earnings has been the rapid rise in interest rates. For example, due to Extra Space’s floating rate debt exposure being nearly 29% of its total debt, the Company guided towards an interest expense increase of 54% from $219 million in 2022 to $337 million at the midpoint of 2023 guidance. The increase has caused EXR to guide towards immaterial Core FFO growth in 2023 versus its peers, before rebounding in 2024 and beyond. PSA, who has floating rate debt exposure of 10% of its total debt guides towards a more favorable +4% FFO growth in 2023. This is due to PSA’s low leverage profile as floating rate debt only makes up ~1% of its total market capitalization (total market value of all outstanding common shares, preferred equity, and total debt), which compares to EXR who’s exposure is more meaningful at 7%.
Finally, consolidation has been one of the big drivers of bottom line growth for the past thirty years, but higher interest rates make it considerably more difficult. Additionally, the sophisticated revenue management systems, call centers, and immense data were only available to the REITs. However, there are many ‘off-the-shelf’ products that have allowed mom-and-pop owners to level the playing field. As a result, we believe it is only getting more difficult to squeeze outsized profits from acquisitions. Until we get more clarity on the organic growth story in the near-term, we plan to maintain our underweight position to the sector.
Isaac A. Shrand, CFA
ishrand@chiltoncapital.com
(713) 243-3219
Matthew R. Werner, CFA
mwerner@chiltoncapital.com
(713) 243- 3234
Bruce G. Garrison, CFA
bgarrison@chiltoncapital.com
(713) 243-3233
Thomas P. Murphy, CFA
tmurphy@chiltoncapital.com
(713) 243-3211
RMS: 2,601 (7.31.2023) vs. 2,398 (12.31.2022) vs. 3,177 (12.31.2021) vs 1,433 (3.23.2020) and 2,560 (2.21.2020)
An investment cannot be made directly in an index. The funds consist of securities which vary significantly from those in the benchmark indexes listed above and performance calculation methods may not be entirely comparable. Accordingly, comparing results shown to those of such indexes may be of limited use.)
The information contained herein should be considered to be current only as of the date indicated, and we do not undertake any obligation to update the information contained herein in light of later circumstances or events. This publication may contain forward looking statements and projections that are based on the current beliefs and assumptions of Chilton Capital Management and on information currently available that we believe to be reasonable, however, such statements necessarily involve risks, uncertainties and assumptions, and prospective investors may not put undue reliance on any of these statements. This communication is provided for informational purposes only and does not constitute an offer or a solicitation to buy, hold, or sell an interest in any Chilton investment or any other security. Past performance does not guarantee future results.
Information contained herein is derived from and based upon data licensed from one or more unaffiliated third parties, such as Bloomberg L.P. The data contained herein is not guaranteed as to its accuracy or completeness and no warranties are made with respect to results obtained from its use. While every effort is made to provide reports free from errors, they are derived from data received from one or more third parties and, as a result, complete accuracy cannot be guaranteed.
Index performances [MSCI and VNQ] are presented as a benchmark for reference only and does not imply any portfolio will achieve similar returns, volatility or any characteristics similar to any actual portfolio. The composition of a benchmark index may not reflect the manner in which any is constructed in relation to expected or achieved returns, investment holdings, sectors, correlations, concentrations or tracking error targets, all of which are subject to change over time.
Leave a Reply Cancel reply
for more info on our strategy
go now →
for more info on our strategy
go now →
VIEW CHILTON'S LATEST
Media Features
go now →
Contact Us
READ THE LATEST
REIT Outlook
go now →
disclaimers
terms & conditions & FORM ADV
SITE CREDIT
Navigate
HOME
TEAM
REITS 101
Approach
OUTLOOKS
media
Contact
back to top
VISIT CHILTON CAPITAL MANAGEMENT
This property and any marketing on the property are provided by Chilton Capital Management, LLC and their affiliates (together, "Chilton"). Investment advisory services are provided by Chilton, an investment adviser registered with the SEC. Please be aware that registration with the SEC does not in any way constitute an endorsement by the SEC of an investment adviser’s skill or expertise. Further, registration does not imply or guarantee that a registered adviser has achieved a certain level of skill, competency, sophistication, expertise or training in providing advisory services to its advisory clients. Please consider your objectives before investing. A diversified portfolio does not ensure a profit or protect against a loss. Past performance does not guarantee future results. Investment outcomes, simulations, and projections are forward-looking statements and hypothetical in nature. Neither this website nor any of its contents shall constitute an offer, solicitation, or advice to buy or sell securities in any jurisdictions where Chilton is not registered. Any information provided prior to opening an advisory account is on the basis that it will not constitute investment advice and that we are not a fiduciary to any person by reason of providing such information. Any descriptions involving investment process, portfolio construction or characteristics, investment strategies, research methodology or analysis, statistical analysis, goals, risk management are preliminary, provided for illustration purposes only, and are not complete and will not apply in all situations. The content herein may be changed at any time in our discretion . Performance targets or objectives should not be relied upon as an indication of actual or projected future performance. Investment products and investments in securities are: NOT FDIC INSURED • NOT A DEPOSIT OR OTHER OBLIGATION OF,OR GUARANTEED BY A BANK • SUBJECT TO INVESTMENT RISKS, INCLUDING POSSIBLE LOSS OF THE PRINCIPAL AMOUNT INVESTED. Investing in securities involves risks, and there is always the potential of losing money when you invest in securities including possible loss of the principal amount invested. Before investing, consider your investment objectives and our fees and expenses. Our advisory services are designed to assist clients in achieving discrete financial goals. They are not intended to provide tax advice, nor financial planning with respect to every aspect of a client’s financial situation, and do not incorporate specific investments that clients hold elsewhere. Prospective and current clients should consult their own tax and legal advisers and financial planners. For more details, see links below to CRS (Part 3 of Form ADV) for natural person clients; Part 2A and 2B of Form ADV for all clients regarding important disclosures.