Retail REITs: Near Term Capex Caution Despite Strong Fundamentals | June 2024
June 3, 2024
In recent history, e-commerce can be argued as the biggest societal shift to impact commercial real estate. We’ve detailed the topic in retail outlooks from November 2022 and November 2021, and more recently in our Industrial Outlook from March 2024. Many expected the surge in online shopping during the pandemic to supercharge the “death of brick and mortar” retail.
The reality was the exact opposite, albeit with a lag, as increased online sales activity actually illuminated the undeniable importance of an omnichannel strategy (where retailers engage customers through multiple digital and physical touchpoints). Indeed, Target (NASDAQ: TGT), despite growing sales originations online, still fulfilled 97.4% of its sales through one of its physical stores last year. This means that even when a product is purchased online (the sales origination point) it is still shipped through the physical store (fulfillment). Importantly, the percentage of sales fulfilled through a physical store in 2023 is higher than it was in 2019.
This change to retailer thinking cannot be understated. Notably, 2024 is expected to be the third straight year with more physical retail store openings than closings – a monumental shift from the “retail apocalypse” of the past decade. However, new retail development has been anemic for over a decade, and today higher construction and financing costs continue to suppress activity. A combination of surging demand with minuscule supply is typically a recipe for success in commercial real estate.
Despite strong rental growth, two factors are keeping bottom line AFFO (adjusted funds from operations, or cash flow minus maintenance capex) per share growth elusive. As with the broader industry, interest expense increased dramatically in 2023 and will increase again in 2024. More importantly, “recurring” capex (driven by leasing commissions paid to brokers and tenant allowances provided at the start of a lease) remains elevated. When we factor these costs into gross rents, the true “economic” gains from recent leasing activity are not as strong.
We have seen too often that Retail REITs are quick to point out how leasing has generated impressive “signed not open” gross rent levels without mentioning the costs associated with adding the tenants to the portfolio. In our view, the key to reducing recurring capital expenditures is to increase the retention of existing tenants (a trend already underway). Even if the rental increase from a renewal isn’t as high as a new lease, controlling downtime and minimizing capital outlays drive stronger AFFO growth over the long term. Going forward, we believe well positioned retail landlords can push tenant retention to new record levels.
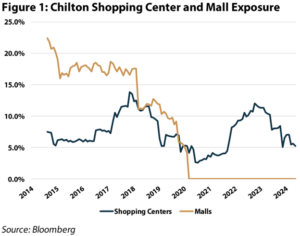
Unfortunately, the inflection point remains elusive given the cyclical ebbs and flows in retail activity. We have seen tepid indications that late 2025 could present a ramp, but our analysis has not yielded enough conviction to meaningfully overweight the group (Figure 1 highlights our composite weighting since 2014). Rather, we maintain an in-line weighting to the Shopping Center REITs, and are using a “rifle shot” approach to the sector to select relative winners in line with our time tested and comprehensive analysis.
E-commerce
For most of the 2000s, as shoppers flocked online, pundits ceaselessly called for the death of brick-and-mortar retail. This narrative contributed to a bleak retail leasing environment post the 2008/2009 Great Financial Crisis (GFC) and drove a dearth in any retail development (more on this later). Counterintuitively, as the pandemic supercharged online shopping, it also flipped the death narrative on its head. Retailers discovered the vital need for an omnichannel strategy in today’s day and age.
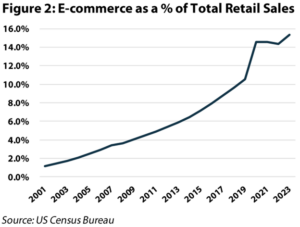
Looking further back (and more broadly), total U.S. retail sales have grown at an average rate of roughly 4% since 2001. This is broken down into +3.2% annual growth for traditional brick & mortar sales and +17.1% annually for e-commerce growth. As a result, highlighted in Figure 2, e-commerce sales as a percentage of total retail sales have increased from barely over 1% in 2001 to over 15% in 2023. However, the most profitable distribution channel for retailers is in the store, a fact that was ignored during the boom of e-commerce with faster and faster deliveries and unlimited free returns (and even a period where there was no sales tax for out-of-state purchases!).
Expanding on our Target example from above, sales originated online increased from ~9% of the total in 2019 to 18% in 2023. Due to the prohibitive shipping cost from warehouses direct to consumers (and vice versa for returns), Target’s physical stores (closer to the consumer) actually became more important to the bottom line. The increase in fulfillment from physical stores helps to reduce shipping costs (to and from consumers) and drive profitability. As a result, Target has a multi-year plan to open 300 new stores across the country, including 39 in 2024.
Other retailers are following suit. “Digitally native” retailers (retailers that began online-only) are opening their first physical stores as they appreciate the benefits presented by brick-and-mortar locations, which include: adding a sales/fulfillment channel, reaching new customers, engaging customers directly with the product, lowering customer acquisition costs, and substantially reducing shipping expenses in both directions.
Net Decline in Supply
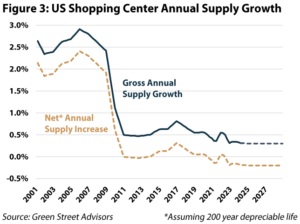
In the early 2000’s, the industry was developing between 2-3% of existing retail supply each year (see the solid blue line in Figure 3). This level is indicative of a growing market, with healthy supply increases each year. However, following the GFC, retailers invested in their e-commerce platforms, bringing new shopping center construction to only 0.5% per year. This is roughly in line with typical obsolescence (e.g., assuming a 200-year usable life), which means actual shopping center supply was effectively unchanged over the past decade (the dashed yellow line represents net supply assuming a 200-year life). Looking at actual demolitions, according to data from Costar, roughly 155 million square feet of retail space has been razed in the last 5 years. In our view, reported demolitions likely understate true obsolescence, but this number still implies roughly 25 bps of total supply has been eliminated annually (on 12 billion sqft of total space). More recently, with the increase in construction and financing costs, the industry only developed 0.3% of existing supply in both 2022 and 2023 (according to estimates from Green Street Advisors), and this is expected to continue for the foreseeable future. This means, after factoring in obsolescence, actual supply is flat at best and likely shrinking! As such, we expect shopping center occupancy to remain strong over the near term.
Leasing Momentum Drives Quality
With demand inflecting and supply remaining anemic we are currently in one of the strongest retail leasing environments in recent history. As a result, re-leasing spreads reached double digit levels last year, and, without any material new development to speak of, rental increases look to remain strong over the coming year. Unfortunately, as we expand upon in the next section, higher rents have not always translated to the bottom line after factoring in broker commissions, tenant allowances, and downtime.
On the positive side, replacing a weak tenant with a stronger retailer improves the quality of property. These changes are difficult to quantify and may not show up in the bottom line for year, but, in our view, should drive a lower cap rate for a center and higher valuation. For example, lenders will look at the percentage of tenants that are investment grade rated. Furthermore, a new, fresh tenant could drive foot traffic to other stores, thus raising the rent potential and tenant retention of the whole center upon lease expiration.
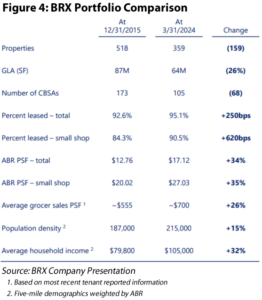
A prime example is Brixmor (NYSE: BRX), which is the most recent retail stock added to the Chilton Composite and has spent the better part of the past decade upgrading and repositioning their nationwide portfolio of centers. Figure 4 compares BRX’s portfolio at the end of 2015 to the portfolio as of March 31, 2024. Over eight years, BRX trimmed the portfolio from 518 properties to 359 (in 68 fewer markets), while materially improving portfolio statistics (grocer health, population density, and household income). As a result, average rents have risen 34% since 2015 with a stronger underlying tenant roster. Despite this drastic improvement, BRX’s stock price is actually lower than it was at the end of 2015. We believe that the market is not appreciating the gargantuan effort BRX has done to reposition the portfolio, thus creating a higher predictability of cash flow growth going forward.
Tenant Fallout: Bed Bath Case Study
Taking a step back, 2020’s extreme environment effectively flushed out weaker retailers and set the stage for enhanced rent rolls. As a result, and based on the strong recovery in consumer spending, 2021 and 2022 had no material tenant bankruptcies. Bed Bath and Beyond’s (OTC: BBBYQ) bankruptcy last year, while fully telegraphed by lagging results, highlighted the sector’s risk to large tenant fallout. However, as shown in Figure 5, while BBBYQ was certainly a material headwind, retail REIT occupancy ended 2023 higher than it started the year, and overall REIT occupancy remains close to an all-time high.
Additionally, Bed Bath’s rent was well below current market rates, and, with robust demand from other tenants, landlords were able to re-lease these spaces at very healthy rent increases (typically 25-30%+). BBBYQ’s problems were well known by consumers and investors; as a result, BBBYQ was not drawing foot traffic to centers and was a blemish on a center’s rent roll. Despite this positive outcome, the re-leased Bed Bath space will remain a headwind in 2024 due to the loss of rent while the new tenant space is under construction (12-18 months for BBBYQ boxes in this case). By the time the BBBYQ space has been occupied by the new tenant and begins paying rent (sometime in mid-2025), there could be another major retailer bankruptcy of concern.

Retention and Occupancy Growth are Key
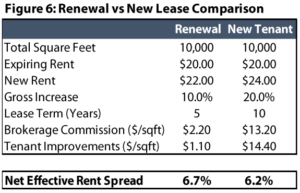
In our view, the only viable path to combatting this challenge is to increase the retention of existing tenants. Typically, the rental increase on a renewal is smaller than what the landlord could achieve on a new lease. However, with a renewal there is no downtime in between tenants, which means rent payments never miss a beat. Second, brokerage commissions associated with renewal leases are typically around 2% while new leases garner 5-6%+ of total gross rent. Finally, when a new tenant occupies a space, the landlord typically provides a tenant renovation budget to prepare the space (which is then amortized over the life of the lease for accounting purposes but is an immediate cash outlay that reduces Funds available for Distribution). Controlling for these capital outlays allows a landlord to maximize cash flow growth rather than rental increases. Figure 6 compares a new lease generating a 20% rental increase against a renewal generating just 10%. Assuming a 5.5% commission fee and 6% of rent for tenant allowances, the net effective rent increase is only +6.2%. In comparison, the renewal (which only had a 10% gross increase) garners a 6.7% net effective rent increase after factoring in more modest capital needs (2% commission). In our view, the most prudent, long term focused landlords can differentiate themselves over time, but this dynamic will take years to play out and might not show up in stock performance for some time.
Chilton Positioning
As of May 31st, we are slightly underweight to the shopping center REITs relative to the RMZ. Looking past the very robust leasing environment, we believe recurring capex is poised to remain elevated. As a result, projected cash flow growth in the retail REIT space remains insufficient for us to get overweight the property type.
Instead, we are focusing our exposure on the REITs we think are best positioned to generate outperformance. The first factor is exposure to the fastest growing regions of the country. As we’ve noted many times, we believe migration patterns driven by taxes, crime, cost of living, and business friendliness should keep the Sunbelt growing quicker than the rest of the country. Second, landlords need to be exposed to the right property types, which in our view, is achieved through necessity-based shopping centers (e.g., grocer anchored) in high income suburbs. Finally, with growth remaining elusive in the group, we think it is important to have an outlet for high return redevelopment projects (plus the balance sheet to support investment) to provide another leg of earnings growth. Currently, our shopping center exposure is split between Brixmor Property Group (NYSE: BRX) and InvenTrust Properties (NYSE: IVT).
Thomas P. Murphy, CFA
tmurphy@chiltoncapital.com
(713) 243-3211
Matthew R. Werner, CFA
mwerner@chiltoncapital.com
(713) 243- 3234
Bruce G. Garrison, CFA
bgarrison@chiltoncapital.com
(713) 243-3233
Isaac A. Shrand, CFA
ishrand@chiltoncapital.com
(713) 243-3219
RMS: 2,645 (5.31.2024) vs. 2,727 (12.31.2023) vs. 2,398 (12.31.2022) vs. 3,177 (12.31.2021) vs 1,433 (3.23.2020) and 2,560 (2.21.2020)
An investment cannot be made directly in an index. The funds consist of securities which vary significantly from those in the benchmark indexes listed above and performance calculation methods may not be entirely comparable. Accordingly, comparing results shown to those of such indexes may be of limited use.)
The information contained herein should be considered to be current only as of the date indicated, and we do not undertake any obligation to update the information contained herein in light of later circumstances or events. This publication may contain forward looking statements and projections that are based on the current beliefs and assumptions of Chilton Capital Management and on information currently available that we believe to be reasonable, however, such statements necessarily involve risks, uncertainties and assumptions, and prospective investors may not put undue reliance on any of these statements. This communication is provided for informational purposes only and does not constitute an offer or a solicitation to buy, hold, or sell an interest in any Chilton investment or any other security. Past performance does not guarantee future results.
Information contained herein is derived from and based upon data licensed from one or more unaffiliated third parties, such as Bloomberg L.P. The data contained herein is not guaranteed as to its accuracy or completeness and no warranties are made with respect to results obtained from its use. While every effort is made to provide reports free from errors, they are derived from data received from one or more third parties and, as a result, complete accuracy cannot be guaranteed.
Index and ETF performances [MSCI and VNQ and FNER and LBUSTRUU] are presented as a benchmark for reference only and does not imply any portfolio will achieve similar returns, volatility or any characteristics similar to any actual portfolio. The composition of a benchmark index may not reflect the manner in which any is constructed in relation to expected or achieved returns, investment holdings, sectors, correlations, concentrations or tracking error targets, all of which are subject to change over time.
Leave a Reply Cancel reply
for more info on our strategy
go now →
for more info on our strategy
go now →
VIEW CHILTON'S LATEST
Media Features
go now →
Contact Us
READ THE LATEST
REIT Outlook
go now →
disclaimers
terms & conditions & FORM ADV
SITE CREDIT
Navigate
HOME
TEAM
REITS 101
Approach
OUTLOOKS
media
Contact
back to top
VISIT CHILTON CAPITAL MANAGEMENT
This property and any marketing on the property are provided by Chilton Capital Management, LLC and their affiliates (together, "Chilton"). Investment advisory services are provided by Chilton, an investment adviser registered with the SEC. Please be aware that registration with the SEC does not in any way constitute an endorsement by the SEC of an investment adviser’s skill or expertise. Further, registration does not imply or guarantee that a registered adviser has achieved a certain level of skill, competency, sophistication, expertise or training in providing advisory services to its advisory clients. Please consider your objectives before investing. A diversified portfolio does not ensure a profit or protect against a loss. Past performance does not guarantee future results. Investment outcomes, simulations, and projections are forward-looking statements and hypothetical in nature. Neither this website nor any of its contents shall constitute an offer, solicitation, or advice to buy or sell securities in any jurisdictions where Chilton is not registered. Any information provided prior to opening an advisory account is on the basis that it will not constitute investment advice and that we are not a fiduciary to any person by reason of providing such information. Any descriptions involving investment process, portfolio construction or characteristics, investment strategies, research methodology or analysis, statistical analysis, goals, risk management are preliminary, provided for illustration purposes only, and are not complete and will not apply in all situations. The content herein may be changed at any time in our discretion . Performance targets or objectives should not be relied upon as an indication of actual or projected future performance. Investment products and investments in securities are: NOT FDIC INSURED • NOT A DEPOSIT OR OTHER OBLIGATION OF,OR GUARANTEED BY A BANK • SUBJECT TO INVESTMENT RISKS, INCLUDING POSSIBLE LOSS OF THE PRINCIPAL AMOUNT INVESTED. Investing in securities involves risks, and there is always the potential of losing money when you invest in securities including possible loss of the principal amount invested. Before investing, consider your investment objectives and our fees and expenses. Our advisory services are designed to assist clients in achieving discrete financial goals. They are not intended to provide tax advice, nor financial planning with respect to every aspect of a client’s financial situation, and do not incorporate specific investments that clients hold elsewhere. Prospective and current clients should consult their own tax and legal advisers and financial planners. For more details, see links below to CRS (Part 3 of Form ADV) for natural person clients; Part 2A and 2B of Form ADV for all clients regarding important disclosures.