
2025 Chilton REIT Forecast | January 2025
From January to November, 2024’s REIT market went largely as predicted in the 2024 Chilton REIT Forecast, a welcome feat in the fast-paced modern world, especially given some of the unexpected exogenous economic and political events. Our forecast of +12% to +16% was higher than any sell-side forecast we saw, and we appreciate the confidence from our readers that added to or maintained their public REIT allocations based on our bullish outlook. In spite of a 10-year Treasury yield of 4.2% at the end of November (up 30 basis points (bps) from January), the MSCI US REIT Index produced a total return of +17.4% through November 30, 2024. While the S&P 500 continues to astound, reaching 57 all-time highs in the year, we believe REITs showed their ability to provide diversification, as evidenced by the REIT total return of +16.1% in the third quarter, which compared to the S&P 500’s +5.9% total return.
The headlines around commercial real estate didn’t improve much, but they also didn’t get worse, as banks seem to be patient with borrowers hoping for lower long term interest rates or an accelerated rate-cut cycle. While economic growth was stronger than most expected, this is likely not enough to ‘save’ private deals that were done at peak prices with too-much short-term debt. The reckoning will come when “over-extended” private equity borrowers finally ‘tell the truth’ to their investors, and 2025 could be the year. And, public REITs are ready to pounce with fortress balance sheets and an equity market that seems to be wide open for most companies based upon recent elevated activity.
What transpired in December would most certainly be considered a curveball. While the Federal Open Market Committee cut the Overnight rate by a total of 100 basis points over three cuts in 2024, this still fell short of the market expectation of 150 bps over six cuts at the beginning of 2024. In spite of an expected cut on December 18, the 10-year Treasury yield rose to 4.57% by December 31, 2024, versus a starting point of 3.87% in January. Ultimately, the RMZ produced a total return of -7.4% in December, bringing the full year total return to only 8.8%, below our forecast and certainly below where most expected-on November 30. While it was a disappointing finish, it does make the setup a bit more attractive for 2025, as we will discuss.
Similar to our forecast for 2024, it is difficult (but not impossible) to get bullish on REITs without assuming a decline in the 10-year Treasury yield, as the current relationship between the two would necessitate for REIT prices to fall if the spread were to revert to the historical average. However, the ‘X-Factor’ of accretive external growth discussed in our August 2024 REIT Outlook could be the savior for REIT investors hoping for the third positive year in a row of positive total returns (+23.7% cumulative total return from January 1, 2023 to December 31, 2024). As such, we are forecasting a total return between 10% and 15% for 2025 based on increasingly positive sentiment on public REITs, bringing back positive flows and REITs flexing their balance sheet muscles to enhance growth. With the MSCI US REIT Price Only Index (Bloomberg: RMZ) still 17.2% below the December 31, 2021 peak, and the S&P 500 (Bloomberg: SPX) 23.4% above December 31, 2021 prices, we believe there will be a rotation to this income plus growth asset class.
2024 In Review
Public REITs navigated a complex and dynamic environment in 2024, with performance shaped by evolving macroeconomic conditions and shifting market sentiment. The year unfolded in three distinct phases, each highlighting different drivers of market activity.
Phase 1: Navigating Uncertainty (January 1 – April 30)
The year began under the shadow of persistently high rates and uncertainty about the Federal Reserve’s monetary policy trajectory. During this period, the RMZ posted a total return of -7.4%, reflecting pressure from elevated borrowing costs and cautious investor sentiment. Healthcare and multifamily REITs performed well, buoyed by resilient demand drivers such as aging demographics and sustained housing needs. In contrast, industrial REITs saw growth slow after years of expansion, while self-storage faced demand normalization, both of which weighed on valuations.
Phase 2: Reigniting Optimism (May 1 – November 30)
The narrative shifted dramatically in the second phase, driven by improving inflation data and the Fed’s 50 bps rate cut in September – the first reduction since the hiking cycle began in March 2022. Investor sentiment soared as markets anticipated continued accommodation in 2025, propelling REITs to a robust +26.8% total return during this period. Data centers (+41.5%) and healthcare (+40.9%) led the rally, with data centers benefitting from AI-driven demand and healthcare supported by demographic tailwinds and improving fundamentals primarily in senior housing.
Phase 3: A December Disruption (December 1 – December 31)
The optimism of the second half faded in December as concerns over the potential inflationary impact of President Trump’s policies and the Fed’s hawkish tone weighed on sentiment. The Fed’s mid-December meeting signaled fewer rate cuts in 2025 than previously anticipated, rattling markets. This shift led the RMZ to post approximately 15 consecutive days of negative returns, culminating in a -7.4% decline for the month. By year-end, earlier gains were partially erased, though absolute valuations are more attractive as a result.
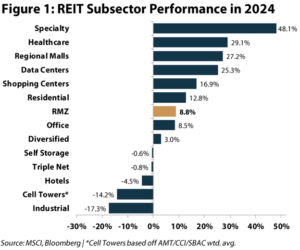
Across the REIT universe, there was notable dispersion among subsectors throughout the year, as shown in Figure 1. Specialty (+48%), healthcare (+29%), and regional malls (+27%) outperformed, driven by structural tailwinds and resilient fundamentals. Meanwhile, industrial (-17%), cell towers (-14%), and hotels (-5%) struggled, reflecting challenges such as cooling demand and elevated interest rate sensitivity. This divergence highlights the importance of active management in identifying opportunities and navigating sector-specific risks.
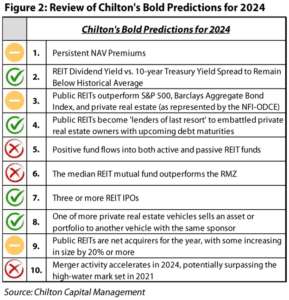
In reviewing our bold predictions for 2024 (Figure 2), we accurately anticipated several key trends. Public REITs outperformed private real estate investments and the Barclays Aggregate Bond Index (Bloomberg: LBUSTRUU), but fell short of the S&P 500. Notably, we correctly forecasted three REIT IPOs, including the largest REIT IPO in history, underscoring the sector’s resilience and ability to attract capital despite market uncertainties. However, we were incorrect in expecting positive fund flows into REIT funds; while this year was much better than 2023 (only -$3 billion vs -$23 billion in 2023), we are hopeful for a reversal to positive flows in 2025. Meanwhile, predictions such as persistent NAV premiums were partially correct, with certain subsectors achieving premiums while others remained under pressure.
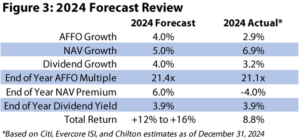
Revisiting our 2024 forecast (Figure 3), we projected NAV growth of +5.0%, AFFO growth of +4.0%, and dividend growth of +4.0%. Actual growth estimates came in at +6.9%, +2.9%, and +3.2%, respectively. We also anticipated an end-of-year AFFO multiple of 21.4x, a NAV premium of +6.0%, and a dividend yield of 3.9%, but actual results were 21.1x, -4.0%, and 3.9%. The 10-year Treasury yield, forecasted to remain flat at 3.9%, instead saw significant volatility – peaking at 4.7% in April, dropping to 3.65% in September, and finishing near 4.55%.
Overall, 2024 underscored the importance of active management amidst market volatility. While the year delivered periods of strong performance, December served as a reminder of the challenges that lie ahead. As REITs continue to adapt to shifting macroeconomic conditions and policy environments, strategic positioning will remain critical to navigating risks and capturing opportunities.
2025 Forecast
The December selloff discussed above clearly displayed that Fed policy remains in the driver seat for the broader market and especially REITs. Even after some hawkish tealeaves came out of December’s commentary, the market consensus is still calling for two rate cuts next year, followed by the potential for even further cuts in 2026. As we’ve discussed at length, our team has adhered to the “higher for longer” interest rate camp for some time – which only recently is becoming a more consensus view. For the purposes of our forecast, we are expecting a flat 10-year Treasury yield.
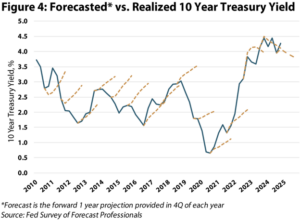
We believe the volatility of interest rates is more consequential than the actual level at which the 10-year treasury yield stabilizes. Figure 4 compares the trajectory of the actual 10-year yield (blue line) against the forward forecast provided in November of each year (dashed gold lines). Importantly, the past two years were the first two times predictions called for falling yields since 2010. Volatility overtook in 2024, but, in our view, a more stable/clear interest rate outlook would help unlock the transaction market and allow well-positioned REITs to capitalize on accretive acquisitions to boost growth. While we do not think higher interest rates would dislodge the attractive set up in REITs, another year of above normal volatility is a risk to our outlook.
Consistent with prior years, in Figure 5 we triangulate between three valuation methodologies (NAV, AFFO and dividend growth) to generate a blended total return outlook for the coming year.
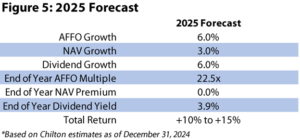
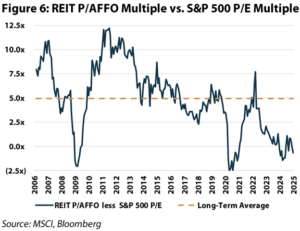
Due to what we see as a ramping medium to long-term growth environment across the REIT universe, our AFFO framework produces the strongest total return outlook. This view is predicated on the continued lack of new supply, which we expect to drive stronger rental growth in 2026 and potentially beyond. To put this more plainly, we think 2026 and 2027 consensus estimates need to move higher for most REITs, which we believe should support multiple expansion from today’s compressed level. Specifically, we estimate AFFO to grow 6.0% next year and, based on the above outlook, we expect the AFFO multiple to expand from today’s 21.1x to 22.5x by the end of 2025. This would produce an impressive 10.9% price return, implying a +14.9% total return inclusive of the dividend yield. Another factor that we believe supports multiple expansion is the relative spread between REITs and the S&P 500’s P/E ratio. As shown in Figure 6, the average REIT P/AFFO multiple is currently at an almost one turn discount to the average S&P 500 P/E multiple. Historically REITs have traded at an average 5 turn premium. While we note that corporate tax cuts decreased REITs relative advantage, today’s discount is still far too wide in our view.
While the AFFO framework represents the high end of our outlook, the dividend methodology suggests relative caution and, therefore, represents the low end of our expectations. This is not due to the level of dividend growth – which we anticipate to remain robust at 6.0% next year – rather, we find it challenging to justify compressing dividend yields if the 10-year Treasury yield remains elevated. Under this conservative assumption, we project the average REIT dividend yield to hold flat at 3.9%. Therefore, we expect price return to be in line with dividend growth at 6.0%, generating a total return of 10.0%.
Under the NAV framework, we project the current 4.0% NAV discount to improve to a 0.0% discount by the end of 2025. Further, we estimate underlying NAVs to grow by 3.0%, supported by 3.0% NOI growth and no change to cap rates (ramping external growth would generate more upside). These assumptions produce a 7.3% price return for the REIT index, which alongside our expected dividend yield implies an 11.3% total return outlook for REITs next year.
Taking all three methodologies together, we forecast a +10% to +15% total return outlook for public REITs in 2025.
Themes
Some public REITs enter 2025 with a luxury they have not had for a long time: NAV premiums. One of our ‘bold predictions’ for 2024, this gives REITs the final tool to be able to raise new equity and maintain low leverage while making accretive acquisitions. Notably, several REITs were able to execute overnight secondary equity offerings at slim discounts to the prior day’s close, and investors rewarded them with a higher closing price on the day of the offering than the pre-announcement closing price – something we have not seen since 2009. We believe that REITs that can raise equity above NAV will have a distinct advantage in 2025, especially if sellers capitulate that interest rates are not coming down significantly. Generally speaking, the sectors that are at a premium to NAV as of December 31, 2024 are healthcare and data centers.
We also believe that REITs with leverage ratios below their target in sectors where borrowing costs remain below acquisition yields will also be able to enhance growth as they ‘lever up’. Even if they are trading at a discount to NAV, we believe that REITs that can demonstrate an accretive acquisition strategy using only free cash flow and debt will be able to close the gap to NAV and potentially garner a premium. Sectors with these characteristics include triple net, self-storage, and shopping centers.
Finally, we believe that companies that can show accelerating earnings growth (leading to above average dividend growth) will be in the best position to outperform in 2025. A tenet that is shared throughout Chilton’s investment philosophy, accelerating earnings growth can lead to positive earnings surprises and garner higher earnings multiples, two primary drivers of stock performance. While average REIT organic growth (as measured by same store NOI) has decelerated since 2021, there are some sectors that will show higher SSNOI in 2025 than 2024. Using consensus estimates, the sectors that qualify for this include regional malls, shopping centers, and self-storage. Furthermore, as rates have now been elevated for almost three years, those companies that have dealt with debt refinancing headwinds will be at an advantage to see bottom line growth accelerate in 2025. The data center, self-storage, triple net, and shopping center sectors should post higher FFO and AFFO growth in 2025 than in 2024.
Chilton Positioning
Using the framework above, the sectors that screen most attractive using these themes are data centers, shopping centers, triple net, and healthcare. As we also are cognizant of valuation and are bottom-up managers, the application of these themes doesn’t always result in overweight allocations to each of these sectors, however. Using our proprietary price target methodology that optimizes risk-adjusted returns, each portfolio holding may not play into all three themes. In fact, there are several that don’t fit into any of the above themes, but valuation (with a catalyst to reach fair value) may be enough influence our investment decisions. Furthermore, as our price targets look out two years, there are several REITs that may check some or all of the boxes by the end of 2026 (when most investors will be looking to 2027 fundamentals/balance sheets). We believe 2026 and 2027 could be robust years for organic growth as the years of low new supply should support above-normal rent and occupancy growth. As such, the largest overweights going into 2025 are healthcare, shopping centers, single family rentals, and cell towers (versus the RMZ, underweight to VNQ). Underweights include lodging, regional malls, industrial, multifamily, office, and triple net. We are equal weight to self-storage and data centers.
Conclusion
While December was a disappointing ending to an otherwise impressive year for REITs, we believe it is important to ‘zoom out’ and be thankful for the returns that have been provided by REITs. As of December 31, 2024, the trailing 10-year total return for the RMZ was +5.7%, just below our long-term forecast of +6-8%. Given the recent pullback, we believe that the next 10 years could be slightly higher at +7-9%, even if interest rates remain elevated. While the S&P 500 bested REITs over the past 10 years by a hefty margin, we remind our readers that ‘envy is the thief of happiness’; in financial terms, REITs did their job of providing income and growth to a diversified portfolio. Going forward, we believe that the asset class will continue to gain acceptance as a key allocation that benefits from economic growth but can also provide downside protection as growth slows and interest rates decline.
Matthew R. Werner, CFA
mwerner@chiltoncapital.com
(713) 243- 3234
Bruce G. Garrison, CFA
bgarrison@chiltoncapital.com
(713) 243-3233
Thomas P. Murphy, CFA
tmurphy@chiltoncapital.com
(713) 243-3211
Isaac A. Shrand, CFA
ishrand@chiltoncapital.com
(713) 243-3219
RMS: 2,966 (12.31.2024) vs. 2,727 (12.31.2023) vs. 3,177 (12.31.2021) vs. 1,433 (3.23.2020)
An investment cannot be made directly in an index. The funds consist of securities which vary significantly from those in the benchmark indexes listed above and performance calculation methods may not be entirely comparable. Accordingly, comparing results shown to those of such indexes may be of limited use.)
The information contained herein should be considered to be current only as of the date indicated, and we do not undertake any obligation to update the information contained herein in light of later circumstances or events. This publication may contain forward looking statements and projections that are based on the current beliefs and assumptions of Chilton Capital Management and on information currently available that we believe to be reasonable, however, such statements necessarily involve risks, uncertainties and assumptions, and prospective investors may not put undue reliance on any of these statements. This communication is provided for informational purposes only and does not constitute an offer or a solicitation to buy, hold, or sell an interest in any Chilton investment or any other security. Past performance does not guarantee future results.
Information contained herein is derived from and based upon data licensed from one or more unaffiliated third parties, such as Bloomberg L.P. The data contained herein is not guaranteed as to its accuracy or completeness and no warranties are made with respect to results obtained from its use. While every effort is made to provide reports free from errors, they are derived from data received from one or more third parties and, as a result, complete accuracy cannot be guaranteed.
Index and ETF performances [MSCI and VNQ and FNER and LBUSTRUU] are presented as a benchmark for reference only and does not imply any portfolio will achieve similar returns, volatility or any characteristics similar to any actual portfolio. The composition of a benchmark index may not reflect the manner in which any is constructed in relation to expected or achieved returns, investment holdings, sectors, correlations, concentrations or tracking error targets, all of which are subject to change over time.
Leave a Reply
for more info on our strategy
go now →
for more info on our strategy
go now →
VIEW CHILTON'S LATEST
Media Features
go now →
Contact Us
READ THE LATEST
REIT Outlook
go now →


