
Seniors Housing REITs: Generational Compounding Opportunity | December 2025
Seniors Housing (SH) REITs are on a historic run. Typically, average SSNOI (same store net operating income) growth is 3-4% for all REITs. In contrast, Welltower (NYSE: WELL), the largest SH owner, is on track for its fourth consecutive year above 20%, and Ventas (NYSE: VTR) is pacing for four years well into double digits. We were notably bullish in our 2023 SH Report, but our expectations proved too conservative.
Stock performance was robust – since September 30, 2023, VTR/WELL produced total returns of 104%/167% versus the MSCI US REIT Index (RMZ) at only 33% through November 30, 2025. Even with exceptional returns, multiples are only modestly higher and, based on several factors, we are even more constructive on the group today. 1) We still see no signs of meaningful new construction (2025 is the 6th consecutive year of declining activity), supporting exceptional internal growth. 2) Large NAV premiums provide attractive currency to drive robust external growth, and the lack of net capital flows into SH by private players is elongating the unprecedented opportunity for high quality assets. Both factors will normalize at some point – but the status quo presents a generational value- creation opportunity for the best positioned REITs. We maintain a 260 bp (basis point) overweight to healthcare relative to our index, which, alongside select Outpatient and SNF exposure, is primarily comprised of three SH REITs:
Ventas Inc (NYSE: VTR) is our largest exposure within SH and the largest relative overweight in our entire portfolio. VTR’s NAV (net asset value, or value of the REITs properties on the private market minus liabilities) premium emerged more recently than WELL, making the company a little late to the acquisition party. However, VTR’s tenured management team has rapidly closed the gap with ~$2.5 billion acquired in 2025 (a record likely to be broken in 2026). Similarly, while WELL led operating margin gains for 2024 and early 2025, VTR’s exceptional results this summer are closing the gap, which we expect to continue into 2026. While we recognize WELL’s successes, we believe the current 16x gap in 2026 cash flow multiples (measured by price / adjusted funds from operations, or P/AFFO) is too wide, and thus we continue to favor VTR (8% position as of 11/30/25).
Welltower Inc (NYSE: WELL) has the largest NAV premium and, therefore, has been the most prolific SH acquirer. In 2025, we estimate it will add $17.5 billion to its property portfolio. We believe the value creation inherent in the acquisition outlook is massive. However, the elevated premium to NAV also presents a risk when the environment normalizes. As we stated above, we prefer VTR at current levels but also maintain a material 5% position in WELL as of 11/30/25.
American Healthcare REIT Inc (NYSE: AHR) was added to the portfolio immediately after its initial listing in February 2024. The company emerged from a non-traded REIT who, despite assembling a quality portfolio, struggled under balance sheet pressures. The equity offering, although dilutive to existing shareholders, repaired the balance sheet and positioned AHR to benefit from the SH upside. With a newfound cost of capital (and balance sheet flexibility), we believe AHR’s comparatively smaller market cap ($9 billion) allows more ability to “move the needle” with acquisitions. As of 11/30/25 we have 3% exposure to AHR.
Overwhelming Demand
Baby Boomer aging is top of mind for investors (and society). Most readers have probably heard reports about the largest generation starting to turn 80. In 2023, the 80+ population was expected to compound at 4.4% over 5 years. This represented a massive acceleration from ~1.7% between 2010-2019, but today’s 5-year outlook is even stronger at +5.0% per year. Furthermore, U.S. births (Figure 1) peaked in 1957 at ~4.3 million, meaning peak 80-year-old growth doesn’t occur until 2037/38.

Dearth of New Supply
Typically, a demand landscape this bullish generates a similarly robust development pipeline. Several factors are holding back SH development today: 1) private equity’s poor returns and cost basis due to entering in the lead up to 2020 (more on Blackstone’s (BX) experience below), and 2) the current state of higher financing and construction costs. Figure 2 highlights the construction pipeline back to 2011, quarterly starts peaked around 12k in late 2017 but have languished since 2020 (most recently down to a meager 2K starts in 3Q25).

Resulting Imbalance = Growth Driver
For 2015-2020 (peak construction period), the industry averaged 30k new units annually while the 80+ population increased by ~100k each year. Over the next 5 years, we expect the 80+ population to grow by 800k annually. Even if construction activity returned to the prior peak, the market would still be meaningfully undersupplied. Construction is still nowhere near the peak; rather activity remains historically low!
Historical averages call for 80+ penetration around 10% (the percentage of elderly people in SH facilities). Noise in this metric is debated (cutoffs, definitions, etc.), but the rough benchmark clearly suggests the 2015-2020 period experienced major overbuilding. If population growth was 100k, delivering 10k units per year would be a balanced market, but developers were adding 30k annually. In fairness, the construction boom filled an underbuilding gap previously generated by the financial crisis in 2008-09, but steep occupancy declines in 2020 exposed overextended developers and marginal operators.
Industry occupancy bottomed in early 2021 at ~78%, but, despite a quick recovery, the ensuing interest rate environment and labor pressures relegated all but the best operators to near distressed levels. As we stated in 2023, new construction will pick up at some point, but every day that development is delayed pushes the imbalance further in landlords’ favor.
Internal Growth
Rapid occupancy growth has been a powerful driver of NOI growth over the past several years. However, as the industry approaches prior peaks, we believe investors underappreciate the amount of NOI upside remaining from occupancy gains. It is important to point out that occupancy gains present a three part benefit to NOI: 1) simply filling a vacant room generates revenue where it previously was zero, 2) margins ramp quicker at higher occupancy levels due to minimal increases in fixed costs once facilities are at 85%+ occupancy rates, and 3) pricing power also improves rapidly at higher occupancy levels (rent grows faster for all residents – not just new residents).
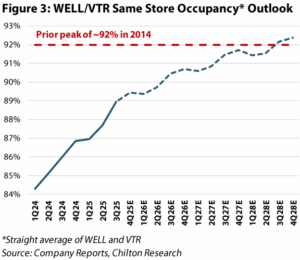
In 2024, WELL and VTR grew same store occupancy by over 300 bps, and 2025 is tracking at a similar level. This has driven impressive SSNOI growth over both years (>20% for WELL and nearly 20% at VTR). Both REITs are likely to surpass 90% occupancy in early 2026. The prior peak for industry wide occupancy was ~92% in 2014, but, given the growing supply-demand imbalance, we believe the REITs can push occupancy materially higher this cycle. With that said, incremental gains should be more challenging at higher occupancy levels, and, therefore, we model occupancy gains normalizing to 180 bps in 2026 and 100 bps in 2027 (Figure 3). However, due to the combination of incremental margins and improved pricing power above the 90% level, we believe the REITs can drive similar SSNOI growth despite smaller occupancy gains.
Affordability
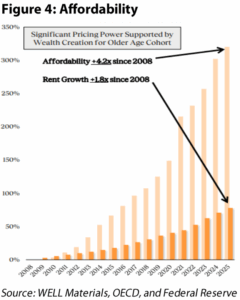
If new supply doesn’t emerge as a headwind, the next likely adversary of robust demand is affordability, i.e., rent can only push so much before tenants balk. Unlike apartment rents, which are highly dependent upon a person’s income, SH rent is typically funded from liquidating assets. Therefore, one should consider rent in relation to wealth appreciation in the senior cohort. As shown in Figure 4, SH rent has increased 1.8x since 2008, but affordability is actually 4.2x higher than it was in 2008 (fueled by massive stock market and real estate gains over the past decade).
Capital Allocation/Why isn’t PE Rushing In?
The pre-2020 construction boom was accelerated by private equity (many new entrants) who ultimately found themselves flat-footed in a lower occupancy environment and a property type that was considerably different operationally relative to most commercial real estate. Blackstone’s (BX) ongoing senior housing liquidation is a helpful case study. The firm’s shopping spree mostly occurred in 2017, quickly amassing a $1.8 billion portfolio across 90 properties (~9,000 units). Despite consolidating operations under its Longview banner, BX was unable to achieve the turnaround desired and opted to throw in the towel starting in 2022. Based on what’s publicly available, BX has sold 70 out of the 90 assets thus far and aggregate proceeds are ultimately expected to come in around $1.2 billion – suggesting a loss of $600 million before considering distributions or investment.
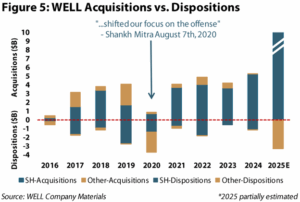
Conversely, Welltower’s current management team took the reins in 2016 and initially positioned the company as net sellers of SH to optimize their portfolio, ultimately selling $12.7 billion of senior housing assets before flipping to offense in late 2020 (Figure 5). This shopping spree resulted in an impressive ~$34 billion purchased over the past five years. VTR’s timeline is slightly different, but the REIT similarly leaned away from SH during the overbuilding phase and re-entered with force in the past few years, accelerating acquisitions as it began to trade at a premium to NAV like WELL.
Why are private owners selling if fundamentals look so attractive? For starters, operating these assets is more complicated than other real estate classes (more labor exposure, food operations, healthcare, etc.). However, the bigger headwind is a combination of elevated basis and floating rate debt exposure, making equity returns extremely sensitive and forcing operators to make short-term decisions at the expense of long-term value creation (underinvesting in maintenance is a compounding negative in this asset class). Funds also contain natural life cycles, which means LPs might be demanding a return of capital even if the GP doesn’t think it’s the right time to sell.
Another helpful example is CNL Healthcare’s strategic merger into Sonida Senior Living (NYSE: SNDA) announced in November. The non-traded REIT formed over 14 years ago and saw its NAV (starting at $10 per share) grind steadily lower – recent third party offers in the $3-4 per share range underlined the illiquidity plight. The portfolio assets were not the problem, as occupancy and NOI recovered post-COVID; rather capital and inflationary pressure squeezed CNL into a penalty box (unable to grow the business). The sale agreement for SNDA at $6.90/sh implies a meager 1-2% annualized total return for shareholders since inception. For comparison, VTR and WELL have generated total returns of ~9% and ~15%, respectively, since 6/27/2011. Upon consummation, the sale will not produce a great return for existing shareholders, but given the alternative of existing in nontraded purgatory, we view the agreement as a potential win-win providing liquidity while unlocking the asset base for future value creation.
This playbook worked well at AHR, emerging from nontraded mediocrity in early 2024 with a NYSE listing at $12/sh (well below NAV at the time). Similarly, they had amassed an impressive portfolio but saw returns and NAV squashed by secular and financing issues. The board’s decisive action initially diluted existing holders in the nontraded REIT, but investors that hung on have enjoyed a 356% total return since the IPO through November 30, 2025! While taking medicine is rarely enjoyable, the early decisive action from this management team now provides AHR with a cost of capital on par with WELL and VTR to participate in the industry’s growth.
External Growth
Our August 2024 outlook (The ‘X’ Factor for REITs) discusses upside potential when REITs trade at persistent premiums to NAV (Net Asset Value), namely how premiums afford attractive capital raising opportunities and accretive acquisitions. For REITs broadly, premiums have been elusive, making the SH opportunity unique. Based on Green Street’s estimates, as of November 30th WELL and VTR stood at 162%/71% premiums to NAV (based on cap rates of 6.7%/7.0% respectively). To slice it another way, based on current stock prices, the implied cap rate of WELL/VTR’s equity is 3.0%/4.9%, which is substantially below the yields they are achieving on recent acquisitions. Using round numbers for illustration, what does it look like if WELL issues equity at 3% and buys assets at a 7% yield? On $1 billion of volume, the assets immediately generate $70 million of annual NOI, which based on WELL’s 3% implied cap rate values the acquired assets at $2.3 billion – immediately generating $1.3 billion of value creation. Given WELL’s share count is around 700 million, this translates into almost $2.00/sh of value creation per $1 billion of acquisitions before even considering any future growth from the properties. This attractive setup has created a positive feedback loop, generating bigger NAV premiums as acquisitions drive more accretion. Based on industry conversations we expect ~$30 billion to come to market annually, and the REITs to remain major beneficiaries.
Valuation
In 2023 we employed a PEG (Price / Earnings to Growth) analysis to justify further upside despite elevated multiples. The same analysis today still justifies upside (especially for VTR), but focusing on only two years understates the longevity behind SH. Even if competition picks up meaningfully next year (a big if) we would still expect 3-5 years of significant internal growth (near current levels). The moat around the REITs deepens every day the current environment remains at the status quo, and we think an upside scenario could generate nearly double-digit growth for 10+ years. To capture this tail, a discounted cash flow (DCF) approach is more appropriate than our normal 2-year forward NAV. Based on internally estimated costs of capital and a terminal growth rate of 3.25% after 2028, we expect double-digit annualized total returns for the group. Additionally, as stock prices increase (or debt costs fall) the resulting decline in cost of capital would further increase our target prices.
Conclusion
We believe the SH cycle is only in the early innings of what could be a long runway of above-average growth and value creation. Compared to our last report on the topic, demand is accelerating further, new supply has fallen to record lows, and the listed REITs enjoy a clear cost-of-capital and operational edge over private competitors. WELL, VTR, and AHR are uniquely positioned to convert this backdrop into compounding NAV per share growth through a combination of continued internal gains and highly accretive external growth. We fully expect noise around rates, headlines, and the eventual restart of development activity, but, in our view, any volatility should be viewed through the lens of a multi-year, not multi-quarter, opportunity. For now, the setup remains rare: we can own high-quality, large-cap REITs with strong management teams, visible double-digit earnings growth, and significant capital allocation optionality at valuations that still underestimate the durability of the cycle.
Thomas P. Murphy, CFA
tmurphy@chiltoncapital.com
(713) 243-3211
Matthew R. Werner, CFA
mwerner@chiltoncapital.com
(713) 243- 3234
Bruce G. Garrison, CFA
bgarrison@chiltoncapital.com
(713) 243-3233
Isaac A. Shrand, CFA
ishrand@chiltoncapital.com
(713) 243-3219
RMS: 3,127 (11.30.2025) vs. 2,966 (12.31.2024) vs. 3,177 (12.31.2021) vs. 1,433 (3.23.2020)
An investment cannot be made directly in an index. The funds consist of securities which vary significantly from those in the benchmark indexes listed above and performance calculation methods may not be entirely comparable. Accordingly, comparing results shown to those of such indexes may be of limited use.)
The information contained herein should be considered to be current only as of the date indicated, and we do not undertake any obligation to update the information contained herein in light of later circumstances or events. This publication may contain forward-looking statements and projections that are based on the current beliefs and assumptions of Chilton Capital Management and on information currently available that we believe to be reasonable, however, such statements necessarily involve risks, uncertainties and assumptions, and prospective investors may not put undue reliance on any of these statements. This communication is provided for informational purposes only and does not constitute an offer or a solicitation to buy, hold, or sell an interest in any Chilton investment or any other security. Past performance does not guarantee future results.
Information contained herein is derived from and based upon data licensed from one or more unaffiliated third parties, such as Bloomberg L.P. The data contained herein is not guaranteed as to its accuracy or completeness and no warranties are made with respect to results obtained from its use. While every effort is made to provide reports free from errors, they are derived from data received from one or more third parties and, as a result, complete accuracy cannot be guaranteed.
Index and ETF performances [MSCI and VNQ and FNER and LBUSTRUU] are presented as a benchmark for reference only and does not imply any portfolio will achieve similar returns, volatility or any characteristics similar to any actual portfolio. The composition of a benchmark index may not reflect the manner in which any is constructed in relation to expected or achieved returns, investment holdings, sectors, correlations, concentrations or tracking error targets, all of which are subject to change over time.
Leave a Reply
for more info on our strategy
go now →
for more info on our strategy
go now →
VIEW CHILTON'S LATEST
Media Features
go now →
Contact Us
READ THE LATEST
REIT Outlook
go now →


