
2026 Chilton REIT Forecast: A Golden Opportunity | January 2026
While underlying fundamentals are improving across most property types, REITs (measured by the MSCI US REIT Index (Bloomberg: RMZ)) underperformed the S&P 500 for the fourth straight year in 2025. With technology stealing headlines due to the incredible potential of AI, investor interest in public REITs continues to languish, ignoring what we view as an improving setup. We believe the confluence of accelerating growth and attractive valuations positions REITs for a multi-year runway of above average total returns.
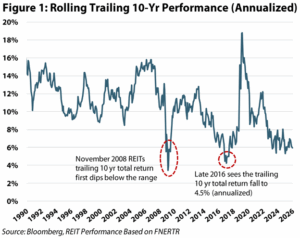
We have stated normal REIT returns should be ~6-8% annually through a cycle, split roughly in half between income and appreciation, with our internal goal to outperform the benchmark by 200 basis points. Looking back, REITs have actually outperformed this range, with an average 10 year annualized total return of nearly +10% going back to 1990 (using Bloomberg: FNERTR). This included sustained periods meaningfully above (~19% annualized ending in 2019) and below (~5% annualized ending in 2009) the long-term average.
In Figure 1, we chart the trailing 10-year annualized total return for each month end going back to 1990 (432 unique time frames starting with the 10-year period ending January 1990). Of these 432 periods, only 26 (or ~6%) saw the trailing annualized return fall below 6%. Note that most of these periods occur in short time spans (such as 2008-09). Using only the first month below the range in each period (e.g., November 2008 is the only GFC month included), there are three examples where trailing 10-year returns fell below 6%: November 2008, October 2016, and April 2023. While past performance is not a guarantee of future results, REITs have produced strong returns following each of these periods. Forward 5-year annualized returns were 20.4% after 2008 and 11.1% following 2016. Thus far, 2023’s below average trailing return period has generated a forward 2-year return of 7.5% annualized.
Additionally, these earlier periods had tangible issues impacting REITs. Today is notably different; REIT earnings growth in most property types is accelerating (measured by adjusted funds from operations, or AFFO), balance sheets are in great shape (net debt/EBITDA of 4.9x; near historic lows), and many REITs possess avenues for accretive external growth.
2026 Forecast
Predictions around capital flows are inherently difficult, so the short-term outlook remains admittedly uncertain. Given elevated earnings growth (~6% vs. the long-term average of 3-4%) and a depressed AFFO multiple (19.7x vs. the long-term average 1-2 turns higher), our analysis suggests a total return of 10% as a base case including the 4% dividend yield. But, more importantly, we believe there is a strong case for multiple expansion in the coming years as income investors eventually rotate back to this this asset class due to the accelerating economy, the contraction in new supply, and the expectation of above average rent growth.
2026-2028 Forecast
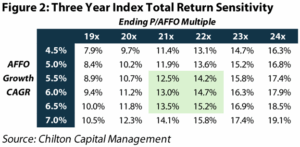
Timing this rotation is a challenging call. Therefore, as highlighted in Figure 2, we are focusing on a three-year outlook. Our sensitivity table shows total return ranges based on AFFO growth (3-year CAGR, or compound annual growth rate) and the ultimate earnings multiple (based on forward 12 months at the end of 2028). We project an AFFO CAGR of 6%, which in our view justifies a return to the historical AFFO multiple of 21.5x. Assuming a starting dividend yield of 4% and dividend growth in line with AFFO growth, this scenario produces an annualized total return of 14%. The green shading below represents a reasonable confidence interval, with annualized total returns ranging from ~13-15%.
2025 Review
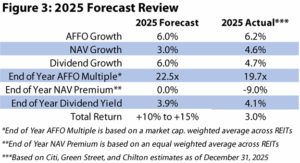
Revisiting our 2025 forecast (Figure 3), we had projected AFFO growth of +6.0%, NAV (net asset value) growth of +3.0%, and dividend growth of +6.0%. Actual results were broadly in-line at +6.2%, +4.6%, and +4.7%, respectively. Where we missed was valuation, as we expected a 22.5x end-of-year AFFO multiple and no NAV premium. However, the group finished at 19.7x and a -9.0% discount, while the dividend yield rose to 4.1%, all of which would have seemed even less likely given the decline in the UST 10-year yield from 4.6% to 4.2%.
Ultimately, despite solid growth, the RMZ generated a total return of +3%, which compared with the S&P 500’s +18%, as shown in Figure 4. The year unfolded in three distinct phases, each driven by a different market narrative.
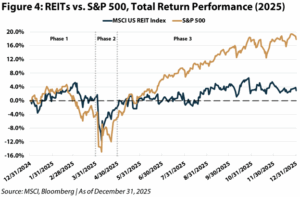
Phase 1: Quiet Start, Brief Lead (January 1 – March 30)
REITs started on steady footing, with the RMZ gaining 1.1% through March and outperforming the S&P 500 by over 500 bps (basis points). Healthcare and Cell Towers led early, supported by demographic tailwinds and a falling UST 10-year yield (from 4.6% to 4.2%). In contrast, Lodging REITs weakened on macro/consumer concerns, while Data Centers lagged following DeepSeek’s release of its cost efficient R1 reasoning model.
Phase 2: Liberation Day Volatility (April 1 – April 30)
Liberation Day marked a seismic shift across the entire market (April 2). REITs outperformed during the first wave of risk-off trading (April 3-4) as the UST 10-year yield briefly fell below 4.0%. However, as the UST 10-year yield reversed (surging 40 bps across two days in one of the steepest yield moves since 2008), REITs saw steep drawdowns in sectors such as Industrial, Malls, and Lodging. The ensuing 90-day tariff pause triggered the S&P 500’s 3rd best single day on record (+9.5% on April 9th). All-in-all, despite the sharp volatility, the RMZ’s decline in April proved more modest than feared (-2.6% total return). Not only did we generate strong alpha through overweight allocations to Cell Towers and Healthcare, but, more importantly, we were able to tactically rotate to quality names that were oversold amid the volatility (notably trimming Cell Towers and adding to Industrial, Data Centers, and Trophy Office).
Phase 3: REITs Diverge as AI Rallies (May 1 – Dec. 31)
Following April’s tariff shock and subsequent relief rally, REITs struggled to keep pace with a market increasingly driven by an AI-focused revival. Investors rotated away from ‘safer’ yield and into higher beta growth, leaving the RMZ modestly higher (total return of 4.6%) from May 1 to December 31, while the S&P 500 climbed +24.0% (a ~1,940 bps gap).
2025 Performance Divergence
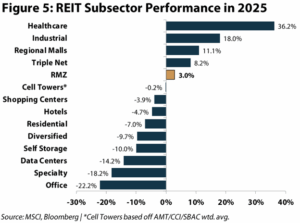
Across the REIT universe, dispersion within property types was remarkably wide in 2025, as presented in Figure 5. Healthcare (+36%), Industrial (+18%), and Regional Malls (+11%) outperformed, driven by structural tailwinds and resilient fundamentals. Meanwhile, Office (-22%), Data Centers (-14%), and Self Storage (-10%) struggled amid weaker demand signals, higher sensitivity to growth narratives, and a difficult macro environment.
Power of NAV Premiums
With so many public REITs trading at a discount to NAV as of December 31, 2025, it is important to revisit the ability, or lack thereof, for management teams and boards of directors to close the valuation gap. The primary job of a management team, and essentially the driving force for becoming a public REIT, is to garner a premium over what the assets are worth in the private market. This unlocks all the benefits that being a public REIT has to offer, including the ability to issue equity without dilution to existing shareholders.
The most notable current example is Welltower (NYSE: WELL), which trades at an NAV premium over 100% as of December 31, 2025. Using this currency, WELL has acquired ~$34 billion since 2020 (and on pace to continue or accelerate the pace) while growing earnings well into the double-digits and maintaining a debt/EBITDA below 3x. The acquisitions have continuously reloaded the portfolio with organic growth opportunities, which has lengthened the tail of cash flow growth, thus feeding the premium that the market is willing to ascribe.
Within the Healthcare sector, Healthcare Realty (NYSE: HR) is a case study in how REITs can generate shareholder value while trading at a significant discount to NAV. HR was trading at a 15% NAV discount to start the year despite a growing appetite for outpatient medical buildings sought by a variety of investors in the private market. The company brought a prominent buy-side investor onto the board and promptly fired the CEO and CFO in mid to late 2024. The new CEO, Peter Scott, was appointed in April 2025, and quickly set out defining the company’s strategic vision. This included continued asset dispositions, right-sizing management and the board, cutting the dividend, and focusing capital into the strongest yielding projects (no more growth for growth’s sake). While still playing out, the stock has gained 20% from the low of $14 per share, and the bold plan of action by management is a stark reminder of the tools that can be used to close the valuation gap, and potentially trade at an NAV premium for an extended period of time.
Management Playbook
When trading at a significant NAV discount, the most typical starting point is simply to sell assets and use that capital to either pay down debt (if needed) or repurchase stock. While shrinking the company may increase the G&A (general and administrative costs) burden as a percentage of invested assets, doing so at least sends a positive signal to the market, especially when done in size. Lower debt ratios also have a high correlation to higher multiples and NAV premiums.
The second tool is cutting costs. REITs are not particularly labor intensive, but rightsizing the board, finding efficiencies in management, and employing automation can make a difference. When growth of only 4-5% is expected, expense controls that can boost growth by 100 bps are significant. Furthermore, dividend cuts that create more free cash flow and set a lower payout ratio also have a high correlation with higher cash flow multiples and NAV premiums.
Third, if none of the above are working, and especially if organic growth is not materializing, the board should question why the company exists. The decision to explore strategic alternatives is not an easy one, but those that make the difficult decision to ‘throw in the towel’ in the best interest of shareholders can boost their own professional reputation for creating shareholder value.
Privatization Wave
2006-2007 was the last wave of major REIT privatizations, and we believe that there is good reason for 2026 to see increased M&A activity relative to the past 18 years. First, capital is plentiful on the private market. According to Preqin, there is over $350 billion in un-deployed capital committed to commercial real estate. While higher than in the recent past, interest rates are similar to where they were in 2006-2007, and potentially going lower given the Fed’s dot plots for future rate cuts. Additionally, REITs have in-place debt that can be assumed at lower rates than where new debt can be sourced. Second, private investors should be clamoring to buy high quality assets for 5-15% less than they would cost on the private market. While a board should not be willing to sell the company for a 20%+ discount to NAV, there is a precedent of transactions in the 5-10% discount range. Third, the buyer would be getting a fully internalized platform, which includes leasing and operations, something requiring time and capital to assemble from scratch.
Most recently, on December 8th, Alexander & Baldwin (NYSE: ALEX) announced that it had agreed to an all-cash take-private offer from MW Capital, Blackstone, and DivcoWest for $21.20 per share, a 39% premium to the prior close. The deal price compares to consensus NAV per share of ~$26, but ultimately it is a positive outcome for shareholders given the company’s inability to grow at such a large discount. We applaud this decision by ALEX’s board, and we encourage all REITs trading at discounts of 15% or more to pursue all three parts of this plan to close the gap.
Takeout Candidates
Based on a potential privatization wave, we have increased exposure to names we view most ripe for privatization. We never rely solely on takeout expectations to justify positions; however, when solid companies trade at persistent discounts we evaluate takeout potential as a catalyst.
Our latest portfolio addition is Centerspace (NYSE: CSR), a Midwest focused apartment REIT which, as a result of a persistent discount, announced a strategic review in early November. The stock increased post announcement, but remains ~15-20% below our estimate of fair takeout value. Given this remaining upside and management’s displayed commitment to maximizing shareholder value, we have built a meaningful overweight in CSR.
Another example is Whitestone (NYSE: WSR), a Sunbelt focused shopping center REIT which has battled activism and takeout attempts for several years. Most recently, on November 4th, MCB Real Estate reinstated its cash offer to acquire the company at $15.20 per share (a 22% premium to the November 3 closing price). While the stock moved higher, as of December 31st, WSR was still priced 9% below the takeout offer. We believe it is in the best interests of all shareholders for the company to initiate a formal process to maximize shareholder value. The MCB offer is at the low end of pricing for comparable transactions and, given the strong fundamentals impacting retail real estate, we would argue that there is more upside versus MCB’s current offer.
Conclusion
We believe public REITs offer an unusually attractive combination of improving cash flow growth, healthy balance sheets, and discounted valuations. Even assuming no multiple expansion, a reasonable base case of mid-single-digit earnings growth plus a ~4% dividend yield can deliver double-digit total returns in the coming years. However, the more important point is that we do see a credible path to multiple expansion over the next several years as investors rotate back into this growth plus income asset class – which we believe can drive 13-15% annualized total returns for several years.
Additionally, wide NAV discounts are presenting near-term catalysts for many names. Management teams have clear levers (asset sales, balance sheet improvement, expense controls, and capital return) to close valuation gaps, and where those levers fail, we believe boards will face rising pressure to evaluate strategic alternatives.
Given the sharp dispersion across sectors and even within property types, we continue to view this as a stock-picker’s market. We highlighted Senior Housing (SH) REITs in last month’s outlooks (our highest conviction theme currently), but we also see attractive setups in Data Centers, Shopping Centers, High Quality Office, as well as pockets of Residential and Triple Net. Our portfolio is positioned where we see the best multi-year fundamentals and the clearest line of sight to value creation, while selectively owning discounted names where constructive change and/or strategic alternatives provide additional catalysts.
Matthew R. Werner, CFA
mwerner@chiltoncapital.com
(713) 243- 3234
Thomas P. Murphy, CFA
tmurphy@chiltoncapital.com
(713) 243-3211
Bruce G. Garrison, CFA
bgarrison@chiltoncapital.com
(713) 243-3233
Isaac A. Shrand, CFA
ishrand@chiltoncapital.com
(713) 243-3219
RMS: 3,054 (12.31.2025) vs. 2,966 (12.31.2024) vs. 3,177 (12.31.2021) vs. 1,433 (3.23.2020)
An investment cannot be made directly in an index. The funds consist of securities which vary significantly from those in the benchmark indexes listed above and performance calculation methods may not be entirely comparable. Accordingly, comparing results shown to those of such indexes may be of limited use.)
The information contained herein should be considered to be current only as of the date indicated, and we do not undertake any obligation to update the information contained herein in light of later circumstances or events. This publication may contain forward-looking statements and projections that are based on the current beliefs and assumptions of Chilton Capital Management and on information currently available that we believe to be reasonable, however, such statements necessarily involve risks, uncertainties and assumptions, and prospective investors may not put undue reliance on any of these statements. This communication is provided for informational purposes only and does not constitute an offer or a solicitation to buy, hold, or sell an interest in any Chilton investment or any other security. Past performance does not guarantee future results.
Information contained herein is derived from and based upon data licensed from one or more unaffiliated third parties, such as Bloomberg L.P. The data contained herein is not guaranteed as to its accuracy or completeness and no warranties are made with respect to results obtained from its use. While every effort is made to provide reports free from errors, they are derived from data received from one or more third parties and, as a result, complete accuracy cannot be guaranteed.
Index and ETF performances [MSCI and VNQ and FNER and LBUSTRUU] are presented as a benchmark for reference only and does not imply any portfolio will achieve similar returns, volatility or any characteristics similar to any actual portfolio. The composition of a benchmark index may not reflect the manner in which any is constructed in relation to expected or achieved returns, investment holdings, sectors, correlations, concentrations or tracking error targets, all of which are subject to change over time.
Leave a Reply
for more info on our strategy
go now →
for more info on our strategy
go now →
VIEW CHILTON'S LATEST
Media Features
go now →
Contact Us
READ THE LATEST
REIT Outlook
go now →


