Chilton 2020 REIT Forecast | January 2020
January 1, 2020
What a year it was for real estate securities! We are proud that we had the highest forecast for the year relative to prominent sell side research firms. However, even our +12-17% projection came up short relative to the actual 2019 MSCI US REIT Index (Bloomberg: RMSG) total return of 25.8%. As a result of the ‘revaluation’ of REITs that occurred for various reasons that we will discuss, we updated our 2019 forecast to +22-29% on September 1, which ultimately proved timely and accurate. Our projections on the economy proved correct as well, given job growth and GDP growth only slightly decelerated from 2018 levels, and we did not enter a recession.
What did we get wrong? Our projection that interest rates would be ‘range-bound’ certainly was a ‘miss’. Instead, the 10 yr Treasury yield dropped by 80 basis points (or bps), from 2.7% on December 31, 2018 to 1.9% on December 31, 2019. This caused REITs to trade at higher multiples on cash flow than we had anticipated. Taking a step back from the numerical projections and results, our ‘street high’ forecast for 2019 indicated that we liked the investing environment going into 2019 and those who listened certainly benefited.
Going into 2020, we again believe investors should increase or maintain REIT allocations in their portfolios given strong fundamentals, a solid economy, and fair valuations. Fundamentals should be similar to 2019, while the valuations are slightly less discounted than they were a year ago. Accordingly, we are projecting a total return +8% to +12% for the MSCI US REIT Index for 2020, which is inline to slightly higher than most of the forecasts we have seen on Wall Street.
2019 Review
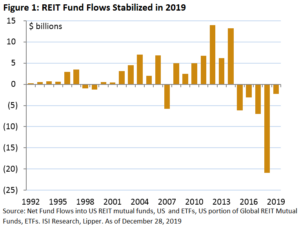
REITs started the year with a bang, climbing to the high end of our original forecast within four months of releasing the ‘Chilton 2019 REIT Forecast’ on January 2, 2019. Part of our bullish forecast was predicated on REITs being able to close the above average discount to net asset value (or NAV) merely through stabilization of fund flows away from REITs. After the record $21 billion in outflows from REIT mutual funds and ETFs (including the US portion of Global REIT mutual funds and ETFs) in 2018, which coincided with the -4.6% total return for the MSCI US REIT Index (the worst year since 2008), REIT funds and ETFs had $165 million of net inflows in the first five weeks of the year. While flows did turn negative in 2019 as shown in Figure 1, the $2.4 billion of net outflows year to date as of December 27 was actually best year since 2014.
As of December 13, 2019, Citi Research projects that 2019 FFO (Funds from Operations) growth will finish the year at +3.4% and AFFO (Adjusted Funds from Operations) growth will be +2.9%. Therefore, the 2019 REIT performance is mostly explained by an increase in multiples. Accordingly, the weighted average 2019 REIT FFO multiple has increased from 14.1x on January 4, 2019 to 18.7x as of December 31, 2019. 2019 FFO consensus revisions were only -0.5% thus far according to JP Morgan, indicating that consensus 2019 estimates from a year ago were mostly ‘inline’ with the latest consensus estimates. Note that we will receive the 2019 actual FFO and AFFO reports in early 2020.


Similarly, REITs have gone from a 14% NAV discount as of January 2, 2019 to a 3% NAV discount as of December 31, 2019. According to JP Morgan, this was also accompanied by a weighted average 6% increase in consensus NAV/share estimates throughout the year. This compares to our initial forecast of a 1% increase in NAV, which was predicated on a 0.25% increase in capitalization rates (or ‘cap rates’). A cap rate is calculated by dividing the current quarter annualized net operating income by the total enterprise value of a REIT or REIT property. Instead of a 25 bps increase, cap rates were decidedly lower in 2019 due to the fall in interest rates, while same store net operating income growth was inline with our forecast. In our revised 2019 forecast of +22-29% from the September 2019 REIT Outlook, we changed our cap rate assumption to a decline of 0.1%, but maintained the original SSNOI (Same Store Net Operating Income) and dividend yield assumptions, which resulted in an estimated 6% increase in NAV/share as well.
2020 Forecast
We believe 2020 has a good chance of achieving double digit total returns again. Wall Street research projects 2020 FFO growth to be in the +4-5% range, which is acceleration from the expected 3.4% for 2019. Similarly, AFFO growth should be in the +5-6% range, which is almost double the 2019 estimated growth of +2.9%. Combining the cash flow growth with a dividend yield of 4% as of December 31, 2019, we are able to get to a base case of a +9-10% total return for REITs assuming no change in multiples.
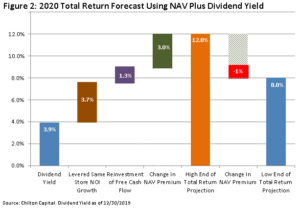
We also use NAV growth, change in NAV premium, and dividend yield to forecast REIT total returns. We believe fundamentals are sufficiently strong to support equity REITs trading near or inline with NAV, which would be consistent with the 30 year average. As of December 31, REITs were trading at a 3% NAV discount, which leaves room for a 3% increase in premium to get to the historical average.
Assuming a slight deceleration of SSNOI growth from +2.5% in 2019 to +2.25% in 2020 (+3.7% using leverage) and free cash flow after dividends and maintenance capital expenditures of 1.3% , we project NAV growth to be +5% assuming no change in cap rates. Combining the +5% change in NAV and an expected -1% to +3% change in the NAV premium, we believe REIT prices will finish the year 4-8% higher, and the additional 4% in dividend yield helps to arrive at a overall REIT index forecast range of +8-12%.


Risks to the Forecast
The biggest risks to our forecast include an abrupt increase in interest rates and a decline in demand commensurate with a slowing economy. Due to the length of the construction cycle, we do not see supply as a major risk to REITs on a blended basis.
A rise in interest rates without a reacceleration in economic growth could cause cap rates to increase, which could decrease REIT prices. As of December 31, 2019, the weighted average REIT implied cap rate was 5.5%, which is below the historical average. However, we feel comfortable with the current valuation given that the 10 yr Treasury yield was 1.9% as of the same date, resulting in a spread (difference) between the two of 360 bps. This compares to the historical average of 360 bps, indicating that REIT prices are actually fair.
Similarly, the spread between the dividend yield and the 10 yr Treasury yield is more than adequate. In fact, the 200 bps spread as of December 31, 2019 compares to the long term average of 130 bps, which implies a cushion of over 70 bps! We expect REITs to increase dividends another 5% in 2020, which would imply a total return of 8.9% assuming a constant dividend yield, giving further credence to our 2020 total return forecast.


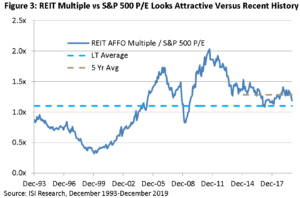
In addition, the weighted average REIT AFFO multiple was relatively high at 21.7x, which compares to the historical average of 16.9x. However, the average from 2015-2019 has been 21.5x, and the REIT AFFO multiple relative to the S&P 500 P/E multiple remains below the five year average, as shown in Figure 3. Notably, the all-time high AFFO multiple was 26.6x, occurring in February 2007. As recently as August 2019, the multiple was as high as 22.4x, which gives us comfort that REITs are not in ‘expensive’ territory going into 2020.
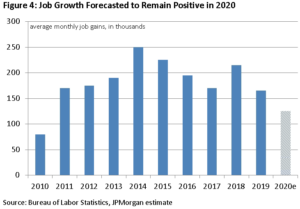
From a demand perspective, the biggest risk would be a recession or a major change in job growth. Though possible, we view 2020 as unlikely to surprise to the downside. 2019 already absorbed many of the effects of tariffs, and we believe 2020 is more likely to experience less disruption from tariffs than 2019. This should lead to increased business confidence, investment, and hiring. Current consensus estimates call for job growth to be slightly lower than 2019, as shown in Figure 4. Providing further protection for REIT investors, any downside surprise would likely drive the 10 yr Treasury yield lower again, which could have a positive (or at least relatively positive) effect on REITs.


Property Type Overweights
Similar to December 31, 2018, the largest overweight in the composite was Data Centers/Tech as of December 31, 2019. However, because we focused on cell towers within the sector in the 2018 Chilton REIT Forecast, we will highlight data centers this year. Due to some of the positive fundamentals we will mention below, we increased the allocation during the year from 9.3% on December 31, 2018 to 12.2% on November 30, 2019. This compares to an 8.6% data center weight in the MSCI US REIT Index as of November 30, 2019. We own three data center names in the Chilton REIT Composite: Coresite (NYSE: COR), QTS (NYSE: QTS), and Equinix (NASDAQ: EQIX). In fact, EQIX became the largest holding in the Chilton REIT Composite in 2019, the first such time that a data center REIT has held that title.
We felt confident increasing data centers based on the large pullback by the sector in 4Q18. The straight average of the five data center REITs produced 4Q18 total returns of -14.2%, which compared to the RMS at -6.7%. We believed these REITs got caught up in the selling of technology equities such as Facebook (NASDAQ: FB), Apple (NASDAQ: AAPL), and Netflix (NASDAQ: NFLX), which were all down at least 25% over the same period. Adding to our conviction, 2018 was an all-time record year for leasing at the data center REITs, which included huge leases by the same companies! While they are tenants of the data center REITs, the prices should not follow each other given that AAPL, NFLX, and FB should continue to spend on infrastructure due to robust demand. Our shift to an overweight proved prescient as the straight average year to date total return of the same five data center REITs in 2019 through November 30 was +36.5%, which compared to the RMS at +26.7%.
Going into 2020, we believe our data center holdings are well-positioned for another strong year due to above average growth rates in FFO. Albeit selling at premiums to NAV, we believe that the valuation of the group is reasonable as the data center sector has still underperformed the RMS from December 31, 2017 to November 30, 2019. As a result, the blended FFO multiple is lower than the REIT average, which was not the case from 2016-mid-2018. In addition, capital expenditures by ‘hyperscalers’ (GOOGL, MSFT, etc.) are expected to reaccelerate and more enterprise customers are anticipated in 2019, which should lead to higher leasing, and also sustain dividend growth substantially above the REIT average.
The second largest overweight in the Chilton REIT Composite is office. The office sector has lagged for most of the current cycle, which began in 2009. However, office has historically been a strong late cycle performer as its long term leases generally allow for positive re-leasing spreads given that the expiring leases were signed so much earlier in the cycle at lower rent levels. We believe office REITs with strong development pipelines are one of the biggest beneficiaries of the recent pullback in interest rates, as their cost of capital is nearing historic lows at a time when they can still build to 7% or higher yields and generate significant incremental value for shareholders. Some of the most notable developments by the REITs include The Academy in Hollywood by Kilroy Realty (NYSE: KRC), One Vanderbilt in New York City by SL Green (NYSE: SLG), and Salesforce Tower in San Francisco by Boston Properties (NYSE: BXP).
Understanding that Manhattan and Washington, DC are among the worst office markets in the country due to excess supply, we favor West Coast and Sunbelt office REITs in the Composite where leasing economics are excellent. We believe generalist investors have stayed away from office REITs due in part to the dominance of New York centric companies in the sector and the recent lack of FFO growth. However, 2020 FFO and AFFO growth among our holdings should average 6% and 7%, respectively, which compare favorably to the REIT averages.
Finally, we remain overweight to the residential sector, which includes a much more significant allocation to single family rental REITs than at this point in 2018. Blackstone (NYSE: BX) fully exited its huge position in Invitation Homes (NYSE: INVH) this year, which now allows the company to use equity raises for external growth and to potentially decrease leverage. American Homes 4 Rent (NYSE: AMH) delivered some of its first for-rent development communities in 2019, which will bear fruit in the 2020 numbers. The company plans to deliver 2,000 homes in 2020, roughly double the number of homes produced in 2019. Importantly, AMH achieves a cost advantage of 15% relative to outright acquisition prices and the homes are built to better standards. Both companies should lead the residential sector in same store revenue growth in 2020, which should translate to leading same store NOI growth given they have shown improvement in controlling expenses.
Maintain or Increase Your Allocation to REITs
The above average total return in 2019 should be viewed as a ‘catch-up’ for several years of lackluster returns for the space, particularly in 2018. While we don’t expect another 40 years of REIT returns averaging 12% per year, the annualized total return from 2015-2019 has only been 5.8%. Therefore, to merely achieve a six year annualized total return of 8%, 2020 would have to produce a 13% total return.
Not to be overlooked, most equity REITs have spent the last few years upgrading portfolios that temporarily resulted in lower growth rates in earnings. Going into 2020, REITs should see the reward for these efforts and also enjoy accretive acquisitions and lower blended interest expense on existing debt.
In addition, given the growth of non-core property types such as towers, data centers, and timber, ‘old-fashioned’ generalizations about REITs are not productive and could lead to poor investment decisions. Therefore, we advocate that REITs should be a strategic allocation in all portfolios, particularly using an active manager that can take advantage of the differentiated business models, property types, and valuations available in the sector.
To reiterate from last year, we are not in the business of forecasting S&P 500 returns. But, we do feel there is less risk to making projections for REITs versus traditional equities. In particular, the trade deal with China, the election, and the near term economic growth could drastically change the outcome for the S&P 500 performance (to the upside or downside). However, we believe REIT performance will be somewhat insulated from the above risks. In addition, the high relative dividend yield coupled with the visibility of dividend growth well into 2022 is an attractive attribute in a low interest rate environment.
The ‘x-factor’ remains capital flows into/out of REITs, which will be determined by consultants, investment committees, and generalist portfolio managers around the world. As shown in Figure 1, these investors have shunned REITs despite the positive performance, especially adjusting for risk. If we and others in the industry are able to further our cause of REIT investment education, the positive flows could propel REIT performance above our expectations for 2020 and beyond.
Matthew R. Werner, CFA
mwerner@chiltonreit.com
(713) 243-3234
Bruce G. Garrison, CFA
bgarrison@chiltonreit.com
(713) 243-3233
Richard J. Pickert, CFA
rpickert@chiltonreit.com
(713) 243-3211
RMS: 2402 (12.31.2019) vs 1909 (12.31.2018) vs 346 (3.6.2009) and 1330 (2.7.2007)
Previous editions of the Chilton Capital REIT Outlook are available at www.chiltonreit.com/category/library/reit-outlook/.
An investment cannot be made directly in an index. The funds consist of securities which vary significantly from those in the benchmark indexes listed above and performance calculation methods may not be entirely comparable. Accordingly, comparing results shown to those of such indexes may be of limited use.
The information contained herein should be considered to be current only as of the date indicated, and we do not undertake any obligation to update the information contained herein in light of later circumstances or events. This publication may contain forward looking statements and projections that are based on the current beliefs and assumptions of Chilton Capital Management and on information currently available that we believe to be reasonable, however, such statements necessarily involve risks, uncertainties and assumptions, and prospective investors may not put undue reliance on any of these statements. This communication is provided for informational purposes only and does not constitute an offer or a solicitation to buy, hold, or sell an interest in any Chilton investment or any other security.
for more info on our strategy
go now →
for more info on our strategy
go now →
VIEW CHILTON'S LATEST
Media Features
go now →
Contact Us
READ THE LATEST
REIT Outlook
go now →
disclaimers
terms & conditions & FORM ADV
SITE CREDIT
Navigate
HOME
TEAM
REITS 101
Approach
OUTLOOKS
media
Contact
back to top
VISIT CHILTON CAPITAL MANAGEMENT
This property and any marketing on the property are provided by Chilton Capital Management, LLC and their affiliates (together, "Chilton"). Investment advisory services are provided by Chilton, an investment adviser registered with the SEC. Please be aware that registration with the SEC does not in any way constitute an endorsement by the SEC of an investment adviser’s skill or expertise. Further, registration does not imply or guarantee that a registered adviser has achieved a certain level of skill, competency, sophistication, expertise or training in providing advisory services to its advisory clients. Please consider your objectives before investing. A diversified portfolio does not ensure a profit or protect against a loss. Past performance does not guarantee future results. Investment outcomes, simulations, and projections are forward-looking statements and hypothetical in nature. Neither this website nor any of its contents shall constitute an offer, solicitation, or advice to buy or sell securities in any jurisdictions where Chilton is not registered. Any information provided prior to opening an advisory account is on the basis that it will not constitute investment advice and that we are not a fiduciary to any person by reason of providing such information. Any descriptions involving investment process, portfolio construction or characteristics, investment strategies, research methodology or analysis, statistical analysis, goals, risk management are preliminary, provided for illustration purposes only, and are not complete and will not apply in all situations. The content herein may be changed at any time in our discretion . Performance targets or objectives should not be relied upon as an indication of actual or projected future performance. Investment products and investments in securities are: NOT FDIC INSURED • NOT A DEPOSIT OR OTHER OBLIGATION OF,OR GUARANTEED BY A BANK • SUBJECT TO INVESTMENT RISKS, INCLUDING POSSIBLE LOSS OF THE PRINCIPAL AMOUNT INVESTED. Investing in securities involves risks, and there is always the potential of losing money when you invest in securities including possible loss of the principal amount invested. Before investing, consider your investment objectives and our fees and expenses. Our advisory services are designed to assist clients in achieving discrete financial goals. They are not intended to provide tax advice, nor financial planning with respect to every aspect of a client’s financial situation, and do not incorporate specific investments that clients hold elsewhere. Prospective and current clients should consult their own tax and legal advisers and financial planners. For more details, see links below to CRS (Part 3 of Form ADV) for natural person clients; Part 2A and 2B of Form ADV for all clients regarding important disclosures.