
REITs: The Cure for High Rates is High Rates | November 2026
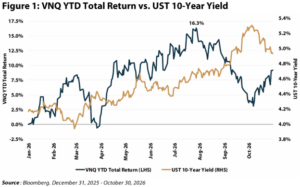
After a strong first half, REITs, as measured by the Vanguard Real Estate ETF (NYSE: VNQ), have given back a meaningful portion of their 2026 gains as interest rates moved sharply higher (Figure 1). Notably, the U.S. Treasury (UST) 10-year yield hit its highest level since 2002 in early October, resulting in a ~6% pullback in the VNQ from its July 28 peak.
The pullback in public REITs coincides with a steady drumbeat of negative headlines from the private market. In our October 2026 REIT Outlook, we analyzed ~$42 billion of 2020-2022 vintage floating rate apartment loans and found roughly one in four is not covering its debt service today. Since publication, a $1.3 billion Blackstone multifamily loan went to special servicing after missing its October maturity, and the transaction market has frozen. We expect these headlines to get worse before they get better, as rate caps continue to expire and interest-only periods roll into amortization. Furthermore, the futures market prices in three MORE rate hikes by the end of 2027.
What these headlines fail to capture is the positive side of higher rates for existing landlords. New construction remains largely shut off across most property types, as development economics do not pencil with elevated construction costs and ten-year secured debt above 6%. Lower supply today translates into higher rent growth over the next two to three years, and REITs, with ~25-30% leverage and predominantly fixed rate debt, are positioned to capture it. While the move in the UST 10-year yield has a real effect on REIT net asset values (NAVs), even if the magnitude is uncertain until the transaction market thaws, it will have little effect on earnings due to their low leverage. We believe the capital markets and property fundamentals are moving in opposite directions, and that the current dislocation is creating an opportunity for patient investors.
Capital Markets in Disarray
When interest rates move as quickly as they have this fall, REIT stock prices tend to trade on the UST 10-year yield rather than on property level results. Public markets reprice daily, while private real estate values are set by appraisals and comparable sales, both of which are backward looking by nature. Historically, public REITs have led private real estate values by 6-12 months, both on the way down and on the way back up. It takes time for buyers and sellers to agree on what a building is worth at a 5% UST 10-year yield versus 4.6% just a month earlier, and in the interim, the transaction market effectively freezes.
The primary driver of that freeze is the bid-ask spread. Owners who do not need to sell remain anchored to valuations from earlier in the year, while buyers are underwriting today’s cost of debt. When the gap is this wide, transaction volume declines, and the few deals that do close skew toward forced sellers, which makes the available comparable sales look worse than the true clearing price for well capitalized owners.
Additionally, M&A is largely off the table for now. In our January 2026 REIT Outlook, we argued 2026 could see a privatization wave, given plentiful private capital and REITs trading at meaningful discounts to NAV. The year started out that way, with Veris Residential agreeing to be taken private in February at a ~23% premium to its unaffected share price. However, with debt costs ~100 basis points (bps) higher than when that deal was struck, leveraged take-privates no longer pencil for most private buyers. Stock-for-stock consolidation among public REITs, such as the AvalonBay / Equity Residential merger that created Vivmark Residential (NYSE: VMRK) and the pending acquisition of Centerspace (NYSE: CSR) by Independence Realty Trust (NYSE: IRT), remains possible since neither requires new debt. But the floor that private equity bids placed under REIT valuations earlier this year has been removed for the time being. Furthermore, real estate private equity had its worst quarter of fundraising since 2013 in the third quarter, and most of that capital was committed before the UST 10-year yield crossed 5% in mid-September.
Cap Rates and Interest Rates
With the UST 10-year yield up 80 bps year-to-date, the natural question is whether cap rates have risen by the same amount. Historically, the answer has been no. As shown in Figure 2, cap rates and the UST 10-year yield move in the same direction over long periods, but the spread between the two fluctuates meaningfully through a cycle. When rates rise due to a stronger economy, net operating income (NOI) growth absorbs part of the move and cap rates tend to rise less. When rates rise due to inflation without growth, cap rates tend to follow more closely. Today appears to be a combination of both, with the September Consumer Price Index (CPI) at 3.7% compared with core CPI of only 2.6%, suggesting higher energy prices are doing much of the work. Furthermore, when stripping out shelter from core CPI, inflation is running right at 2%.
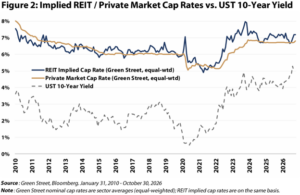
We find it most useful to frame the current environment through leverage. With ten-year secured debt priced above 6%, any property trading below a 6% cap rate is a negative leverage acquisition, meaning debt reduces the buyer’s cash-on-cash yield rather than enhancing it. This describes much of the Class A apartment and industrial markets, where cap rates sit in the high-4% to low-5% range. For these property types, something must give: cap rates have to rise, rent growth has to accelerate, or interest rates have to decline before a leveraged buyer can make the math work. And we don’t see the math working anytime soon. Meanwhile, other sectors may be healthier for leveraged buyers, but sellers could still take a while to de-anchor from the pricing of only a few months ago.
When the transaction market is this thin, we must triangulate from a reasonable expected return, using rent growth and an exit cap rate to solve for the proper entry cap rate to use in our NAVs. Based on our analysis, private market cap rates have risen 25-50 bps from July levels depending on the property type, with the lowest cap rate sectors seeing the most pressure. At ~30% leverage, that translates to an NAV decline of ~7-13%. However, with the median REIT trading at a 10% discount to NAV, we believe public market valuations already reflect this move.
What We Can Model
There are two impacts of higher interest rates we can quantify with reasonable confidence: the change in earnings growth and the change in NAV.
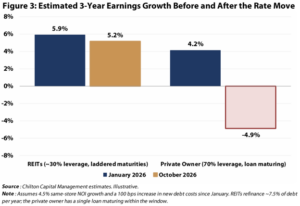
Regarding earnings, REITs carry predominantly fixed rate, long-dated debt, so higher interest rates flow through to earnings slowly as debt matures and is refinanced. As presented in Figure 3, the move in rates trims our estimate of 3-year adjusted funds from operations (AFFO) growth by less than one percentage point. We were already conservative in our model assumptions for debt refinancing, so the move is not as drastic as some would fear. And it is nowhere near the impact a 70% levered private owner would feel if forced to refinance today.
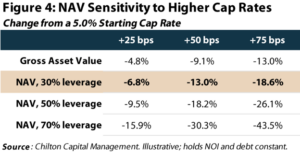
NAV, on the other hand, is far more sensitive. For a property valued at a 5.0% cap rate, a 25 bps increase lowers the gross asset value by ~4.8%, and a 50 bps increase lowers it by ~9.1%. For a REIT with 30% leverage, those declines are magnified to ~6.8% and ~13.0% of NAV, respectively (Figure 4). With the median large-cap REIT (market cap above $10 billion, excluding healthcare given the premium at which it trades) already trading 15% below Green Street’s NAV estimate, the public market is effectively discounting more than a 50 bps increase in cap rates, well ahead of private market appraisals. Notably, a typical private owner with 70% leverage would experience a 43.5% drop in NAV with a 75 bps rise in the cap rate.
What We Can’t Model
There are two additional factors that matter just as much, if not more, but do not fit neatly into a spreadsheet.
The first is NAV premiums and discounts. As we discussed in our January 2026 REIT Outlook, the ability to trade at a premium to NAV is what unlocks the benefits of being a public REIT, most notably issuing equity to grow accretively. Whether REITs trade at a 15% discount or a 5% premium is largely a function of investor sentiment and cost of capital, and it swings widely through a cycle. We cannot predict when sentiment will turn, but historically, wide discounts have tended to narrow once interest rate volatility subsides, not necessarily when rates fall to a specific level.
The second is the long-term benefit of lower supply. Every increase in construction financing costs eliminates another round of planned projects, and those are buildings that will not compete for tenants in 2028, 2029, and 2030. While we know the direction, the magnitude is difficult to quantify, and consensus estimates rarely give credit for it until rents actually accelerate. We believe the supply response to this rate move may ultimately prove to be one of the most valuable benefits for existing landlords in years.
What to Do in Times of Uncertainty
There is no shortage of uncertainty heading into year-end. The midterm elections are on November 3, two wars are pushing energy prices higher, and a new Federal Reserve (Fed) chair, Kevin Warsh, has already raised rates once, with the market anticipating two to three more hikes. Any one of these could move the UST 10-year yield by 25 bps in a week, or nearly 20 bps in a day (as we saw on October 22), and REIT share prices will likely move with it. We cannot predict these outcomes with any confidence, so we prefer to focus on what we know.
First, the economy is in good shape, demand is healthy, and new supply is declining. The combination of steady demand and declining supply should lead to accelerating fundamentals in 2027 and 2028, regardless of where the UST 10-year yield ultimately settles.
Second, inflation should moderate. A large portion of the 2026 increase in CPI came from higher energy prices and shelter costs. In 2027, CPI will be measured against these higher levels, which should put downward pressure on year-over-year figures even if prices simply stop rising. Lower reported inflation gives the Fed room to stop hiking. We believe interest rate stability, more so than rate cuts, is what REITs need to attract fund flows.
Third, the return math does not require heroic assumptions. REITs offer a ~4% dividend yield today, and assuming ~5-7% annual earnings growth for 2027-2028 depending on the sector (which we view as conservative given the supply backdrop), the result is a ~10% total return before any change in valuation. If the NAV discount narrows even partially, returns would be higher. The primary risk to this view is cap rates continuing to rise faster than NOI can grow, which would likely require another meaningful move higher in long-term interest rates from here.
Conclusion
Interest rates are up, and cap rates will follow, albeit more slowly and by less than REIT share prices are implying. We don’t have the answer on where the UST 10-year yield will settle, or NAVs for that matter. The transaction market is likely to remain quiet until the bid-ask spread closes, and headlines from the private side will get worse before they get better. However, REIT earnings continue to grow, new supply continues to shrink, and valuations remain at a meaningful discount to NAV. In a period where fundamentals and capital markets are diverging, we lean toward the fundamentals, especially when the capital markets have a disproportionate effect on private owners. Furthermore, as long-term investors, fundamentals should win out in the end, and we can be patient as some of the exogenous events affecting the capital markets are resolved. We believe a ~4% dividend yield plus ~5-7% earnings growth can deliver ~10% total returns from here, with upside if rate volatility subsides and the NAV discount narrows.
Matthew R. Werner, CFA
mwerner@chiltoncapital.com
(713) 243-3234
Bruce G. Garrison, CFA
bgarrison@chiltoncapital.com
(713) 243-3233
Thomas P. Murphy, CFA
tmurphy@chiltoncapital.com
(713) 243-3211
Isaac A. Shrand, CFA
ishrand@chiltoncapital.com
(713) 243-3219
VNQ: $93.94 (10.31.2026) vs. $88.49 (12.31.2025) vs. $116.01 (12.31.2021) vs. $56.91 (3.23.2020)
An investment cannot be made directly in an index. The funds consist of securities which vary significantly from those in the benchmark indexes listed above and performance calculation methods may not be entirely comparable. Accordingly, comparing results shown to those of such indexes may be of limited use.
The information contained herein should be considered to be current only as of the date indicated, and we do not undertake any obligation to update the information contained herein in light of later circumstances or events. This publication may contain forward-looking statements and projections that are based on the current beliefs and assumptions of Chilton Capital Management and on information currently available that we believe to be reasonable, however, such statements necessarily involve risks, uncertainties and assumptions, and prospective investors may not put undue reliance on any of these statements. This communication is provided for informational purposes only and does not constitute an offer or a solicitation to buy, hold, or sell an interest in any Chilton investment or any other security. Past performance does not guarantee future results.
Information contained herein is derived from and based upon data licensed from one or more unaffiliated third parties, such as Bloomberg L.P. The data contained herein is not guaranteed as to its accuracy or completeness and no warranties are made with respect to results obtained from its use. While every effort is made to provide reports free from errors, they are derived from data received from one or more third parties and, as a result, complete accuracy cannot be guaranteed.
Index and ETF performances [VNQ and FNER] are presented as a benchmark for reference only and does not imply any portfolio will achieve similar returns, volatility or any characteristics similar to any actual portfolio. The composition of a benchmark index may not reflect the manner in which any is constructed in relation to expected or achieved returns, investment holdings, sectors, correlations, concentrations or tracking error targets, all of which are subject to change over time.
Leave a Reply
for more info on our strategy
go now →
for more info on our strategy
go now →
VIEW CHILTON'S LATEST
Media Features
go now →
Contact Us
READ THE LATEST
REIT Outlook
go now →


