Takeaways From the Citi Global Real Estate Conference | April 2019
April 1, 2019
In March, the Chilton REIT team participated in the Citi Global Real Estate Conference in Fort Lauderdale, FL, attended by over 185 CEOs of real estate companies from around the world. Perhaps slightly influenced by the +12.0% year to date total return of the MSCI US REIT Index as of March 1, 2019 (the day before the conference), the domestic real estate CEOs communicated optimism about the economy and their specific businesses. We were able to sit down in one-on-one meetings with CEOs of 37 companies, and actively participate in group meetings of another 30 companies over a three-day period. The conference confirmed our confidence in the positive near-term outlook for high quality US real estate, and gave us new insight into several companies and sectors.
Retail Transformation Through Experimentation
Owners of all regional shopping centers are in the midst of a multi-year transformation. The uncertainties related to retail tenants and other risk factors, such as high leverage, have created a negative sentiment among public REIT investors. As a result, the public mall REITs traded at an average discount to net asset value (or NAV) of 26%* as of March 26, 2019. If one excludes Simon Property Group (NYSE: SPG), an exceptional “A” mall REIT with a fortress balance sheet, the discount widens. On the private side, price discovery is illusive as there have been few transactions. High quality malls are held by strong owners and are simply not for sale, and there are few natural buyers for anything below top tier assets, other than badly distressed assets where the bids reflect little more than land value. Between these two extremes, there is a large pool of viable, positive cash flow property, but clearing prices may await more clarity on the evolution of the middle-market mall.
In the midst of all the negatives, we believe investors are not giving enough credit to “town centers”, effectively serving as a “downtown” in middle-markets and often more vital to its community than the Class A mall in a major metropolitan area. Even as many of these were designed decades ago with layout and tenant mixes that would be obsolete today, public companies with sufficient financial resources are devoting capital to rebalance tenant mixes and footprints in markets where the location and position within the trade area are worthy. In addition, there are numerous examples where local municipalities have contributed financially to ensure the success of the local mall. We see evidence that this is working.
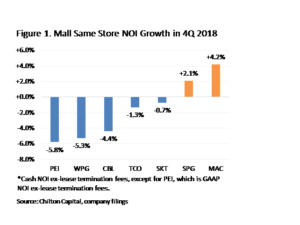
Most notably, alternative uses are being used to fill both vacant department store boxes and “in-line” space within the mall. We believe progress will be gradual and achieved only through experimentation. Lifestyle and Service leasing accounted for 70% of all leasing activity at CBL Properties (NYSE: CBL) and Seritage Growth Properties (NYSE: SRG), and 50% at Washington Prime Group (NYSE: WPG) in 2018. Entertainment, Food & Beverage, Fitness, Home, and Specialty retailers are leading these expanding sectors. In addition, REITs are taking advantage of excess land (often created by the departure of department stores) to densify many locations with apartments, office, and/or hotels. Mall owners should ultimately witness returns on investment in the 7-10% range, but not before experiencing more bumps on the road from temporary declines in net operating income for most participants as failing retailers vacate (see Figure 1). As a result, there is significant upside to many retail REITs if they can prove values will be at least stable in the near term until the market sees the ecosystems created by the transformations.


Office in the West is Better Than the Rest
We continue to believe the strongest office markets remain on the West Coast. The demand drivers from technology, media, and life sciences stand out in an environment of limited supply. Accordingly, we expect above average rental growth for the foreseeable future. Douglas Emmett (NYSE: DEI), which dominates the West Los Angeles office market, has developed a proprietary management and leasing platform by structuring its business model to have many of the same characteristics as apartment REITs. The average tenant size is only 1,500 square feet (or sqft.) and the company handles 40% of leasing without outside brokers, resulting in a speedy consummation of a lease with lower fees. After zero acquisitions in 2018, it expects external growth to resume using its joint venture format.
In contrast, Manhattan had a near-record year in leasing at 36 million sqft., but rent levels are flat to down on a net basis given significant new supply from the massive Hudson Yards project on the West side. SL Green (NYSE: SLG), a 100% NYC REIT, has a clear road map for above average growth in FFO by 2021 due to the opening of One Vanderbilt in 2020, a 1.7 million sqft. office project adjacent to Grand Central, and the redevelopment of 450 West 34th. However, with the stock price is languishing around an 18% discount to NAV as of March 29, 2019, due to the negative sentiment on Manhattan. At the conference, SLG’s CEO Marc Holliday pledged to close the gap through significant buybacks. He estimates that SLG has already created $380-570 million of incremental NAV by buying back $1.9 billion of shares since 2017.
Many of the office REIT CEOs touched on the “co-working” phenomenon that is becoming a major factor in office leasing across the United States. We believe shared workspaces are here to stay, and most believe it is a net positive for the office sector. For example, many companies that are unsure of space needs in the future have increasingly been leasing space in this format. Washington REIT (NYSE: WRE) has initiated its own brand called ‘Space Plus’ within its portfolio in Washington, DC. Many defense contractors like the optionality and are willing to pay a premium to the normal rent. We, however, are not sure how a 100% co-working company with short term customers will survive an economic downturn.
Healthcare and Triple Net at Premiums Due to Low Risk
Healthcare and Triple Net REITs (including Gaming REITs) are enjoying multiyear highs in their stock prices (all-time highs for some!) due to their simple story of highly predictable internal growth through annual lease bumps and external growth through a robust acquisition environment.
The three Gaming REITs (MGM Growth Properties (NYSE: MGP), VICI Properties (NYSE: VICI), and Gaming and Leisure Properties (NYSE: GLPI) participated in a panel in which they contested that their sector may be the only one that could experience cap rate compression. While many REIT property types are at all-time low cap rates on the private market, gaming properties trade at cap rates 200-300 bps higher than a typical triple net property. This is in spite of the somewhat defensive nature of the casino operators, which, for example, experienced less than a 4% decline in cash flow in the 2008-2009 period.
The triple net REIT sector, excluding Gaming, is trading at an average NAV premium over 40% as of March 28, 2019. Therefore, as long as their stock prices are buoyed by low interest rates, CEOs are positive on using external growth to bolster an otherwise slow organic growth sector.
Healthcare REIT CEOs made the case for strong fundamentals as a result of the ageing population. However, they were more positive on medical office buildings and life science than skilled nursing and senior housing. In particular, the operators (REIT tenants) of skilled nursing and senior housing facilities have been under extreme pressure recently, forcing rental rate reductions that will allow the tenant to stay in business. However, we met with a CEO of a skilled nursing REIT who was very bullish on the sector long term as a result of the planned implementation of a Patient Driven Payment Model (or PDPM), a new Medicare reimbursement model, in October 2019. This should improve margins for the operators and allow for the rents that have been reset to become more secure.


Apartments Solid as a Rock
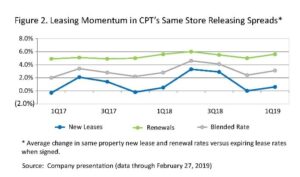
The apartment REITs provided an update on year to date same store revenue growth, showing 2019 guidance may have been too conservative. In particular, Camden (NYSE: CPT) CEO Ric Campo emphasized that 2019 is the third consecutive year that the first quarter showed accelerating rent growth (Figure 2). He also opined that he gives a very low probability to the privatization of Fannie Mae, although it would be beneficial for apartment REITs if it did happen due to their superior access to capital. New supply remains a headwind in some markets, but AvalonBay (NYSE: AVB) CEO Tim Naughton cautioned that the risk of new supply can often be overstated as 8-15% of projects get delayed every year.


Hotel Roller Coaster
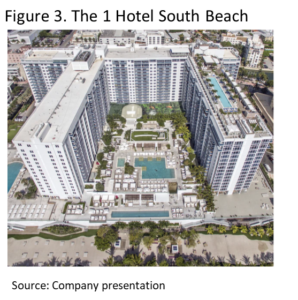
Lodging REITs were some of the hardest hit in 4Q 2018, some of them dropping by over 30% over the short period. However, most have rebounded in 2019 despite not much of a change in earnings expectations. We were able to conduct a property tour of The 1 Hotel South Beach (see Figure 3), a recent $610 million acquisition by Host Hotels (NYSE: HST), in conjunction with the conference. HST is able to flex its fortress balance sheet in the current environment to make accretive acquisitions. In addition, the company has extensive knowledge of finding efficiencies upon acquiring hotels, though it has been conservative in underwriting this particular acquisition. HST is particularly bullish on Miami hotel performance in 2020 given that the Super Bowl will be held in the city during the busiest quarter of the year.
How Long Will the Industrial Party Last?
Industrial REIT fundamentals remain the best outside of the tower space, but we felt that management teams were increasingly managing investor expectations for future rent growth. Data from CoStar (NASDAQ: CSGP), Jones Lang LaSalle (NYSE: JLL), and CBRE (NYSE: CBRE) show that national industrial vacancy has been near 20-year lows for 3 quarters in a row now. In addition, net absorption (demand) outpaced new completions (supply) for the 9th straight year in 2018. Cap rates are likewise at all-time lows, falling by 20-50 bps over the past year. Amazon (NASDAQ: AMZN) remains the biggest and most controversial tenant in the sector, with some attendees touting their exposure to the firm while a vocal minority are steering clear given the company’s track record of driving hard bargains with its landlords and suppliers. As an example, XPO Logistics (NYSE: XPO) is a tenant of several industrial REITs and also works with Amazon on delivery fulfillment. In the two weeks leading up to the conference, XPO’s share price fell 19% after it announced that Amazon had decided to self-perform most of XPO’s services.
Pricing and rental growth remains strongest for “last mile” properties in high-income urban areas, but the outlook appears increasingly bright for temperature-controlled warehouses, as well. Americold (NYSE: COLD) continued to disclose more information about its $600 million build-to-suit program in Australia, for which it maintained its guidance of stellar 12-13% yields. The company also provided color on the recent acquisition of Preferred Freezer by Lineage Logistics, its two largest competitors, explaining that the management team passed on the deal primarily because most of Preferred Freezer’s real estate assets are leased as opposed to owned.


Data Center Story Intact, but Not Priced as Such
Our meetings with data center REITs left us with two main takeaways. First, 2018 was the best year ever for data center leasing, both in the wholesale and network-dense market segments. Full year wholesale leasing in the top five US markets broke the previous 2016 record by 32%, and new annual records were set in Northern Virginia, Phoenix, and the four largest European markets. REITs pointed out that 4Q18 leasing was light primarily because most cloud service providers (CSPs) had already hit their annual capex and lease commitment limits by the end of 3Q18. None believed the 2018 tech sell-off had factored into light 4Q18 numbers at all, as site selection and lease negotiations take several quarters, and most CSPs and enterprises still reported that they were struggling to keep up with demand.
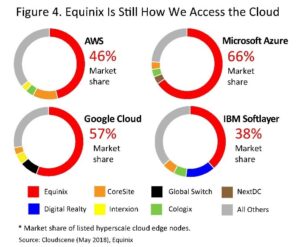
Second, our meetings strengthened our belief that the days of double-digit wholesale development yields are behind us. High single-digit development yields are still accretive, and Digital Realty (NYSE: DLR) and CyrusOne (NASDAQ: CONE) are best-positioned to take advantage of the growing hyperscale demand. EQIX is the only data center REIT that has had much success in large platform acquisitions, and even it has been weighed down in recent quarters by underperformance in the Verizon/ Terremark portfolio that it acquired in May 2017.
Self Storage Supply Not Shrinking
Supply was once again the theme of this year’s self storage meetings, with most REITs and nearly all REIT investors pessimistic about supply coming down absent a recession. Self Storage REITs have underperformed the RMS by over 600 bps YTD as of March 28, 2019, but we think it is still too early to get back into this space. 8-10% stabilized development yields remain healthy compared to 5-6.5% implied cap rates for the self storage REITs, and with increased availability of non-recourse construction debt and mezzanine financing, we do not see an end to this building boom any time soon.
*Straight average of Chilton NAVs for PEI, CBL, SRG, SKT, WPG, SPG, MAC, and TCO
Parker Rhea, prhea@chiltonreit.com, (713) 243-3211
Matthew R. Werner, CFA, mwerner@chiltonreit.com, (713) 243-3234
Bruce G. Garrison, CFA, bgarrison@chiltonreit.com, (713) 243-3233
RMS: 1909 (12.31.2018) vs 2000 (12.31.2017) vs. 346 (3.6.2009) and 1330 (2.7.2007)
Previous editions of the Chilton Capital REIT Outlook are available at www.chiltonreit.com/reit-outlook.html.
An investment cannot be made directly in an index. The funds consist of securities which vary significantly from those in the benchmark indexes listed above and performance calculation methods may not be entirely comparable. Accordingly, comparing results shown to those of such indexes may be of limited use.
The information contained herein should be considered to be current only as of the date indicated, and we do not undertake any obligation to update the information contained herein in light of later circumstances or events. This publication may contain forward looking statements and projections that are based on the current beliefs and assumptions of Chilton Capital Management and on information currently available that we believe to be reasonable, however, such statements necessarily involve risks, uncertainties and assumptions, and prospective investors may not put undue reliance on any of these statements. This communication is provided for informational purposes only and does not constitute an offer or a solicitation to buy, hold, or sell an interest in any Chilton investment or any other security.
for more info on our strategy
go now →
for more info on our strategy
go now →
VIEW CHILTON'S LATEST
Media Features
go now →
Contact Us
READ THE LATEST
REIT Outlook
go now →
disclaimers
terms & conditions & FORM ADV
SITE CREDIT
Navigate
HOME
TEAM
REITS 101
Approach
OUTLOOKS
media
Contact
back to top
VISIT CHILTON CAPITAL MANAGEMENT
This property and any marketing on the property are provided by Chilton Capital Management, LLC and their affiliates (together, "Chilton"). Investment advisory services are provided by Chilton, an investment adviser registered with the SEC. Please be aware that registration with the SEC does not in any way constitute an endorsement by the SEC of an investment adviser’s skill or expertise. Further, registration does not imply or guarantee that a registered adviser has achieved a certain level of skill, competency, sophistication, expertise or training in providing advisory services to its advisory clients. Please consider your objectives before investing. A diversified portfolio does not ensure a profit or protect against a loss. Past performance does not guarantee future results. Investment outcomes, simulations, and projections are forward-looking statements and hypothetical in nature. Neither this website nor any of its contents shall constitute an offer, solicitation, or advice to buy or sell securities in any jurisdictions where Chilton is not registered. Any information provided prior to opening an advisory account is on the basis that it will not constitute investment advice and that we are not a fiduciary to any person by reason of providing such information. Any descriptions involving investment process, portfolio construction or characteristics, investment strategies, research methodology or analysis, statistical analysis, goals, risk management are preliminary, provided for illustration purposes only, and are not complete and will not apply in all situations. The content herein may be changed at any time in our discretion . Performance targets or objectives should not be relied upon as an indication of actual or projected future performance. Investment products and investments in securities are: NOT FDIC INSURED • NOT A DEPOSIT OR OTHER OBLIGATION OF,OR GUARANTEED BY A BANK • SUBJECT TO INVESTMENT RISKS, INCLUDING POSSIBLE LOSS OF THE PRINCIPAL AMOUNT INVESTED. Investing in securities involves risks, and there is always the potential of losing money when you invest in securities including possible loss of the principal amount invested. Before investing, consider your investment objectives and our fees and expenses. Our advisory services are designed to assist clients in achieving discrete financial goals. They are not intended to provide tax advice, nor financial planning with respect to every aspect of a client’s financial situation, and do not incorporate specific investments that clients hold elsewhere. Prospective and current clients should consult their own tax and legal advisers and financial planners. For more details, see links below to CRS (Part 3 of Form ADV) for natural person clients; Part 2A and 2B of Form ADV for all clients regarding important disclosures.