
An Overdue Benchmark Change: RMZ to VNQ | June 2026
Since the inception of the Chilton REIT strategy in 2005, we have used the MSCI US REIT Index (Bloomberg: RMZ) as our primary benchmark. However, the REIT landscape has evolved over those 21 years, and so has our investment universe. Due to the lack of inclusion of several new sectors into the RMZ, including cell towers (a prominent component of the Chilton REIT Strategy), we have decided to change our primary benchmark to the Vanguard Real Estate ETF (NYSE ARCA: VNQ), effective June 1, 2026.
The change is appropriate and timely for several reasons: 1) VNQ included cell towers starting in 2018, a sector that has been a 5-25% weighting in the Chilton REIT Strategy for the past 10 years; 2) VNQ is an investable benchmark (there are no ETFs that track the RMZ); and 3) the Global Investment Performance Standards (or GIPS) changed in 2021 to allow ETFs as benchmarks.
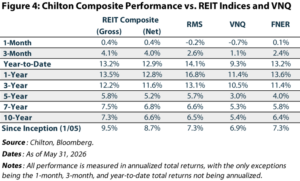
The long-term performance of the benchmarks is remarkably similar, as cell tower outperformance drove the VNQ above the RMZ from 2018 to 2021, followed by underperformance of the VNQ due to cell towers giving back their relative gains in the ensuing 4.5 years. Notably, as of May 31, 2026, the RMZ and VNQ have produced 10-year annualized total returns of +6.5% and +5.4%, respectively. In comparison, the Chilton REIT Strategy has produced gross and net annualized total returns of +7.3% and +6.6%, respectively, over the same time period.
Total return indices finally recovered to the December 2021 peak for the RMZ and Chilton in February 2026 and the VNQ is close behind; however, price-only levels remain well below the prior peak. As such, while the S&P 500 price only index is 59% above the 12/31/2021 peak, the RMZ and VNQ prices are 8% and 18% below levels on that day. Similarly, the S&P 500 is trading at a P/E multiple that is relatively in-line with the prior peak, while REIT multiples are well below 2021 levels. Despite the strong year-to-date total returns of VNQ (+9.3%) and the RMZ (+14.1%), we believe that upside still remains as there is more room for multiple expansion as fundamentals improve and earnings growth rebounds from lackluster levels over the past several years.
History of RMZ
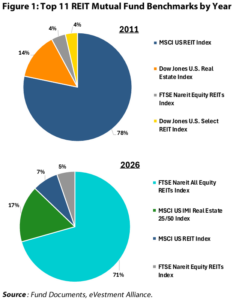
When the Chilton REIT Strategy was founded, the MSCI US REIT Index was by far the dominant benchmark for US actively managed REIT strategies. Of the top 11 US REIT active mutual funds in 2011, eight used the MSCI US REIT Index, comprising 78% of the $22 billion managed, as shown in Figure 1. Notably, the Vanguard Real Estate ETF, one of the largest ETFs in the world, also tracked the MSCI US REIT Index, putting an estimated 65-75% of all REIT passive and active strategies either tracking or benchmarking against the index. We viewed this as the gold standard, and appropriately made it our objective to outperform this index by 200 basis points (bps) per year.
However, in 2012 things began to change. American Tower (NYSE: AMT) had received a private letter ruling in 2011 paving the way for AMT to convert to a REIT for the 2012 calendar year and creating a new REIT sector. AMT was added to the FTSE NAREIT All Equity REITs Index (Bloomberg: FNER) but was not added to the other popular REIT indices. AMT was followed by Crown Castle (NYSE: CCI) in 2014, and SBA Communications (NASDAQ: SBAC) in 2016, which were subsequently added to the FNER. Still, the RMZ eschewed making the same change.
These were not small companies. The three cell tower REITs comprised almost 12% of the FNER by 2017, yet the RMZ continued to ignore them. In 2018, the VNQ announced that it would no longer track the RMZ but instead would track the MSCI US IMI Real Estate 25/50 Index (Bloomberg: GU709808), which would include cell towers and other companies that were classified as real estate by the Global Investment Classification Standard (GICS), a new sector created in 2017.
Fast forward to 2026, and only one of the top 11 active REIT mutual funds has the RMZ as its benchmark, comprising only 8% of the $37 billion in total assets in these 11 mutual funds. In addition, after the VNQ’s move to the MSCI US IMI Real Estate, there are no longer any ETFs that track the RMZ, thus making the index no longer an investable benchmark.
Why VNQ?
The VNQ is one of the top 50 largest ETFs in the world by assets and includes what we believe represents our investable universe. It tracked the RMZ from 2004 to 2017, before changing to the MSCI US IMI Real Estate Index in 2018 to include cell towers.
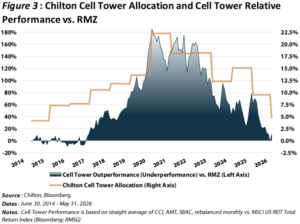
As shown in Figure 3, we have maintained an allocation to the sector since 2014, peaking at over 20% in 2020, and are currently sitting at 5% as of May 31, 2026. Thus, we believe it is now appropriate to change the benchmark to one that includes cell towers. From Figure 1, the most popular REIT indices that include cell towers are the FTSE NAREIT All Equity REITs Index and the MSCI US IMI Real Estate 25/50 Index. Because the MSCI US IMI Real Estate 25/50 Index began in 2018, it is not appropriate to use as a standalone benchmark given the Chilton REIT Strategy’s inception date of January 1, 2005. The FTSE NAREIT All Equity REITs Index does go back to 2005, but we believe the continuity of maintaining the MSCI US REIT Index for 2005-2017 indirectly through VNQ is a smoother transition. In fact, we have been using VNQ as the secondary benchmark for the Chilton REIT Strategy since March 1, 2023. With the move of VNQ from secondary to primary benchmark, we will now use the FTSE NAREIT All Equity REITs Index as our secondary benchmark, also effective June 1.
Allocation Differences between Chilton, FNER, VNQ, and RMZ
As shown in Figure 2, the allocation differences between the benchmarks are somewhat subtle, though a few differences stand out. As mentioned, cell towers comprise the largest difference between the VNQ and FNER when compared to the RMZ. Elsewhere, the VNQ holds real estate service companies (e.g. CBRE, JLL, CoStar, Zillow), while these are not present in the FNER or RMZ. Finally, VNQ and FNER have Timber REITs, while RMZ does not.
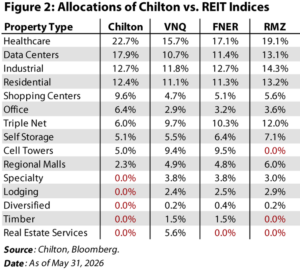
Chilton’s overweights and underweights are somewhat different against the VNQ than they are relative to the RMZ. Specifically, cell towers are now an underweight instead of an overweight, self-storage is now an equalweight instead of an underweight, and industrial is now an overweight instead of an equalweight. Various overweights have been magnified, including data centers, office, shopping centers, residential, and healthcare.
Performance Differences between Chilton, FNER, VNQ, and RMZ
As shown in Figure 3, the cell tower allocation in the Chilton REIT Composite was a positive contributor to relative performance versus the RMZ from 2017 to 2026, though only slightly. From March 2017 to December 2021, the straight average of the cell tower REITs outperformed the RMZ by a cumulative 175 percentage points. However, cell tower REITs gave back the entirety of this outperformance in the ensuing ~4.5 years from January 2022 to March 2026. Notably, we gradually decreased our allocation to cell tower REITs over this period, and, as of May 31, 2026, the 5.0% allocation to cell tower REITs is the lowest since 2014.
Therefore, though it was a rollercoaster up and back down, the corresponding performance of the VNQ and RMZ between March 2017 and May 2026 is remarkably similar. We believe this makes the timing for the benchmark change all the more reasonable as it does not have much of an impact on the relative long-term performance we have generated. Furthermore, the correlation between the Chilton REIT Composite monthly performance and VNQ is 95.6%, which compares to a correlation of 95.1% with RMZ monthly performance.
As shown in Figure 4, the performance since inception, trailing 7 years, and trailing 10 years are remarkably similar. In fact, the trailing 10-year performance is nearly identical between the FNER and the RMS.
A Comment on Recent REIT Performance
Finally, the year-to-date performance of the REIT benchmarks has been outstanding. The performance through May 2026 now has allowed anyone who invested at the peak in December 2021 to recoup their losses on a total return basis.
However, the price-only levels of each of these indices/ETFs has not yet eclipsed the prior peak. With the strong cash flow growth (measured by AFFO per share) that has prevailed for most property types since then, multiples remain well below peak levels, as we laid out in our January 2026 REIT Forecast.
While we are not advocating for REIT multiples to return to prior peak levels in the near term, we do believe our thesis is proving out for a rotation into REITs and out of other equity sectors that are well above December 2021 levels. As an example, the S&P 500 trades at a P/E ratio of 22x as of May 31, 2026, which is roughly in-line with December 31, 2021. In contrast, REITs currently trade at a ~21x AFFO multiple, or~15% below the December 31, 2021 peak multiple of ~25x.
Going forward, we believe that the VNQ presents a better representation of our investing universe. Our goal is to outperform the VNQ by 200 bps annualized over a five-year period, as that is our biggest competition given the $64 billion allocated to this passive strategy as of December 31, 2025. Importantly, we have not changed our research process, which has been able to achieve 260 bps and 220 bps of outperformance versus the VNQ and RMZ, respectively, since inception in January 2005 (180 bps and 140 bps net, respectively) through May 31, 2026.
Matthew R. Werner, CFA
mwerner@chiltoncapital.com
(713) 243- 3234
Bruce G. Garrison, CFA
bgarrison@chiltoncapital.com
(713) 243-3233
Thomas P. Murphy, CFA
tmurphy@chiltoncapital.com
(713) 243-3211
Isaac A. Shrand, CFA
ishrand@chiltoncapital.com
(713) 243-3219
VNQ: $95.70 (5.31.2026) vs. $88.49 (12.31.2025) vs. $116.01 (12.31.2021) vs. $56.91 (3.23.2020)
An investment cannot be made directly in an index. The funds consist of securities which vary significantly from those in the benchmark indexes listed above and performance calculation methods may not be entirely comparable. Accordingly, comparing results shown to those of such indexes may be of limited use.)
The information contained herein should be considered to be current only as of the date indicated, and we do not undertake any obligation to update the information contained herein in light of later circumstances or events. This publication may contain forward-looking statements and projections that are based on the current beliefs and assumptions of Chilton Capital Management and on information currently available that we believe to be reasonable, however, such statements necessarily involve risks, uncertainties and assumptions, and prospective investors may not put undue reliance on any of these statements. This communication is provided for informational purposes only and does not constitute an offer or a solicitation to buy, hold, or sell an interest in any Chilton investment or any other security. Past performance does not guarantee future results.
Information contained herein is derived from and based upon data licensed from one or more unaffiliated third parties, such as Bloomberg L.P. The data contained herein is not guaranteed as to its accuracy or completeness and no warranties are made with respect to results obtained from its use. While every effort is made to provide reports free from errors, they are derived from data received from one or more third parties and, as a result, complete accuracy cannot be guaranteed.
Index and ETF performances [RMZ, VNQ, and FNER] are presented as a benchmark for reference only and does not imply any portfolio will achieve similar returns, volatility or any characteristics similar to any actual portfolio. The composition of a benchmark index may not reflect the manner in which any is constructed in relation to expected or achieved returns, investment holdings, sectors, correlations, concentrations or tracking error targets, all of which are subject to change over time.
Leave a Reply
for more info on our strategy
go now →
for more info on our strategy
go now →
VIEW CHILTON'S LATEST
Media Features
go now →
Contact Us
READ THE LATEST
REIT Outlook
go now →


