
Lodging REITs: Cheap Enough to Bounce, Not Own | August 2026
Following two years of underperformance, lodging REITs surged to the top property type of 2026. Part of the strength reflects improving industry fundamentals. Accordingly, Smith Travel Research revised its 2026 US revenue per available room, or RevPAR, forecast from +0.6% in the February release to +2.8% in the June 2026 release. The upgrade owed little to the World Cup, which was already incorporated, and more to solid group travel (on robust corporate profits) plus a high-end consumer continuing to defy expectations (luxury room rates ~+6% vs ~+2% for select service). However, an important caveat is the higher beta nature of lodging REITs, which are more operationally and financially levered than the C-Corp (“brands”). Therefore, while lodging REITs’ (Bloomberg: DJUSHL) YTD total return is +46% through July 31st, the lodging C-Corps (Bloomberg: DJUSLG) are only +15%. We should also point out that lodging REITs represent a modest 2.6% of our primary benchmark (NYSE: VNQ) and lodging C-Corps are not included at all (see Figure 1).
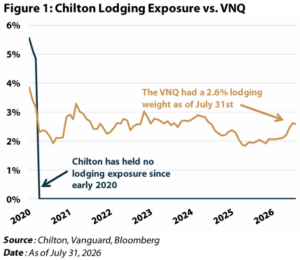
While we hate to miss a rally, we’ve held zero lodging exposure for several reasons: 1) caution on industry fundamentals (soft international inbounds, inflation concerns, and choppy group travel amid macro uncertainty), 2) structural preference for lodging C-Corps over a full cycle (more on this below), and 3) better risk-adjusted opportunities in other property types. Today’s report will cover: 1) the recent trajectory of hotel fundamentals, 2) the structural investment case between REITs and C-corps, and, finally, C) what it would take for us to become constructive on lodging.
Fundamental Backdrop
Before considering 2026’s reacceleration, note the starting point, 2025 was the weakest growth for U.S. RevPAR (essentially flat on nominal dollars) outside of a recession or external shock in Smith Travel Research’s history. The only years RevPAR has outright fallen (2001, 2008–09, and 2020) coincided with a recession or the pandemic; a stall in an otherwise healthy economy is unique. More important than the nominal stall-out is the fact that RevPAR is projected to rise less than inflation for the fourth straight year. Highlighted in Figure 2, although nominal RevPAR is at a record, once adjusted for inflation (constant 2010 dollars) RevPAR actually peaked in 2018 and has quietly eroded ever since (2025 Real RevPAR is roughly back to 2014 levels). This is paramount for an operationally intensive business, where the cost base (labor, insurance, utilities, brand and management fees) rises with inflation. If costs rise faster than revenues, margins compress and real earnings power declines.

Brief Primer: Lodging REIT Structure
Most readers will be more familiar with hotel brands, such as Marriott (NASDAQ: MAR) and Hilton (NYSE: HLT), than with the REITs that typically own the real estate. Brands do not actually own many properties themself, rather they are typically the “flag” (brand name, reservation system, and loyalty program), which collects fees from the actual owner.
Recall, REIT rules allow for passive income (e.g., rent) but do not allow REITs to earn active operating income (similar to Senior Housing REITs). To maintain compliance, the REIT leases the hotel to a taxable REIT subsidiary (TRS). Finally, the TRS engages an eligible independent contractor to operate the property, providing two pathways: managed or franchised. In a managed agreement, the brand operates the hotel and collects a base fee (typically 3-4% of revenue), plus an incentive fee tied to profits (usually the case for full service and luxury assets). Under a franchised agreement, the owner only licenses the flag (for a slightly higher fee) and hires a separate operator who they pay directly (common in select service hotels).
In either structure, the leakage faced by the owner is material because the brand collects its base fee off the top line while the owner is stuck with 100% of the expenses. Figure 3 describes the fee waterfall from total revenues to the cash ultimately retained by the hotel owner. Incentive fees are one part of the equation in which we have little ability to predict as individual property thresholds and (sometimes) cash flows are not disclosed. This adds another layer of difficulty (on top of the ‘daily’ leases) to estimating lodging REIT earnings, which has contributed to the low relative multiples at which lodging REITs trade.

Investment Case: Owners vs. Brands
Conversely, the long-term earnings compounding and predictability is much stronger for the brands (C-Corps) than for the hotel owners (REITs). Starting with the fee structure described above, we believe a claim on revenue rather than profit is a far superior position for a cyclical business with meaningful operational leverage. Consider a downside scenario where revenue may only decline modestly, but, if all the fixed costs remain, the bottom line (profit) impact could be far more severe. Therefore, the decline is not shared equally by the various parties because the brand’s fee is senior to the owner’s entire cost stack.
The capex side is arguably more important. Hotels require regular and intensive refreshes to remain competitive (typically 4-5% of revenue annually), and this burden also comes out of the owners’ economics. Even during challenging years, this cost can only be deferred at the owners’ peril because the risk of becoming uncompetitive within the peer set is drastic. The asset-light framing should not be taken to mean the brands deploy no capital at all. In competitive conversions, the brands may contribute “key money”, which is an upfront payment to the owner in exchange for the contract. However, this is typically structured as a forgivable loan or deferred credit that is subject to repayment if the hotel exits the system prematurely.
Operating Leverage Puts and Takes
This does not mean owning the REITs is never attractive. Owning the real estate provides direct NAV and takeout optionality, a higher current yield, and, most relevant recently, more torque in a recovery cycle. 2026 is a textbook case; coming off 2025’s material decline, the hotel REITs have dramatically outperformed the brands. For investors with conviction in timing the trough, the REITs are the higher beta way to play the bounce. Additionally, another important point is that the REITs’ smaller size allows investors to target specific geographies (e.g., the recent turnaround in San Francisco) or specific hotel types (e.g., focusing on luxury properties). This means specific REITs can vary significantly from national RevPAR figures due to portfolio specifics – while the massive portfolios of MAR and HLT allow for far less variability. In 1Q2026 reported RevPAR growth across the REITs ranged from +2% all the way to +15%.
Another informative example is comparing Host (NYSE: HST), by far the largest lodging REIT, and HLT performance in 2025. Notably, HST’s RevPAR growth of +3.8% meaningfully exceeded the national average due to elevated luxury exposure (plus the Maui recovery), while HLT was much closer to normal at +0.4%. However, HLT’s 1) advantageous fee position, 2) ability to grow through room count rather than just RevPAR, and 3) ancillary earnings streams (credit card, loyalty, etc.) generated earnings per share growth of 13.9% in an otherwise challenging market. Conversely, HST’s RevPAR outperformance only translated to ~3% earnings growth. For a longer-term view, Figure 4 charts HLT’s adjusted EPS and RevPAR (indexed) since 2017 (note 2026 is based on guidance). While RevPAR has only averaged ~2% annual growth, HLT has been able to compound EPS at an average rate above +18%.

REIT RevPAR disclosures make an apples-to-apples comparison difficult (particularly due to acquisitions and dispositions); however, as shown in Figure 5, HST’s annual AFFO growth over the same timeframe is only +2.6% despite similar RevPAR growth to HLT.

Why We Stayed Away
We were admittedly too cautious on fundamentals. However, even with the World Cup, international inbounds presented a clear headwind after turning negative in 2025 (dollar strength and policy friction remain in place). Additionally, group and business travel remained uncertain in our view (corporate travel budgets are susceptible to revisions amid uncertain macro). Finally, we feared that leisure bifurcation was growing too stretched after the high-end consumer carried resort and luxury RevPAR for three consecutive years.
In hindsight, the group’s large NAV discount (over 20% to start the year, see Figure 6) was discounting many of these headwinds. Now that the group has recovered to a modest premium for the first time since 2021, it is important to note that the group has historically struggled to maintain a premium for extended periods.

Most importantly, we saw better risk adjusted returns in other property types. Specifically, our largest overweights in data centers, shopping centers, and healthcare have delivered returns of 32%, 31%, and 25% through July 31st (based on our weightings), competitive with lodging’s 46% but underpinned by contractual revenue growth, favorable supply-demand setups, and balance sheets that do not require a cyclical inflection. Let us be clear, we would rather miss a mean-reversion rally than abandon the tenets that have driven above index compounding for over 20 years.
What Could Make Us Constructive?
Especially following the recent REIT outperformance, we favor the senior fee stream over the levered equity claim on the asset. However, in either direction (REITs or C-Corps) valuation is our primary trigger. For the C-Corps, multiples are elevated with MAR and HLT trading at forward P/E multiples of ~30x and 32x, respectively, which are approximately 15% above the 5-year average (based on data from Bloomberg and as of July 30th). Turning to the REITs, we reiterate that the group has historically struggled to maintain an NAV premium for extended periods of time, so we do not view current valuation as an attractive entry at 1% above NAV as of July 31st (based on estimates from Green Street).
On fundamentals, we want to see demand acceleration driven by occupancy rather than just rate. The increase in expectations for 2026 was once again largely carried by average daily rate (or ADR) at high-end properties, so the bifurcation that we flagged at the end of 2025 is only more stretched today. In our view, occupancy led growth would signal a broader lower/mid-scale recovery cycle. Relatedly, an inflection in international inbound travel would give us more confidence in the duration of the cycle. Finally, although expense growth has moderated somewhat, margins remain under pressure. Until nominal RevPAR consistently runs ahead of costs, we remain cautious on the trajectory for earnings power. Outside of property type wide triggers, we always evaluate special situations on their own merits.
Conclusion
We wrote this month’s outlook to address the strong performance in lodging REITs for 2026. While we admit we misjudged the fundamental improvement, we contend that the REIT outperformance has been a mean reversion rally (boosted by the REITs higher-beta to positive expectation revisions) rather than a true improvement in earnings power. Importantly, inflationary expense pressure remains a headwind and real RevPAR sits well below the 2018 peak. Furthermore, the intense capex burden is a recurring headwind and, finally, we continue to favor the structural advantages of the C-Corp “Brands” over the REIT owners. All told, we remain comfortable with zero lodging exposure given today’s valuation levels, but, as always, we are constantly monitoring valuation and fundamentals for attractive opportunities.
Thomas P. Murphy, CFA
tmurphy@chiltoncapital.com
(713) 243-3211
Matthew R. Werner, CFA
mwerner@chiltoncapital.com
(713) 243- 3234
Bruce G. Garrison, CFA
bgarrison@chiltoncapital.com
(713) 243-3233
Isaac A. Shrand, CFA
ishrand@chiltoncapital.com
(713) 243-3219
VNQ: $98.95 (7.31.2026) vs. $88.49 (12.31.2025) vs. $116.01 (12.31.2021) vs. $56.91 (3.23.2020)
An investment cannot be made directly in an index. The funds consist of securities which vary significantly from those in the benchmark indexes listed above and performance calculation methods may not be entirely comparable. Accordingly, comparing results shown to those of such indexes may be of limited use.)
The information contained herein should be considered to be current only as of the date indicated, and we do not undertake any obligation to update the information contained herein in light of later circumstances or events. This publication may contain forward-looking statements and projections that are based on the current beliefs and assumptions of Chilton Capital Management and on information currently available that we believe to be reasonable, however, such statements necessarily involve risks, uncertainties and assumptions, and prospective investors may not put undue reliance on any of these statements. This communication is provided for informational purposes only and does not constitute an offer or a solicitation to buy, hold, or sell an interest in any Chilton investment or any other security. Past performance does not guarantee future results.
Information contained herein is derived from and based upon data licensed from one or more unaffiliated third parties, such as Bloomberg L.P. The data contained herein is not guaranteed as to its accuracy or completeness and no warranties are made with respect to results obtained from its use. While every effort is made to provide reports free from errors, they are derived from data received from one or more third parties and, as a result, complete accuracy cannot be guaranteed.
Index and ETF performances [RMZ, VNQ, and FNER] are presented as a benchmark for reference only and does not imply any portfolio will achieve similar returns, volatility or any characteristics similar to any actual portfolio. The composition of a benchmark index may not reflect the manner in which any is constructed in relation to expected or achieved returns, investment holdings, sectors, correlations, concentrations or tracking error targets, all of which are subject to change over time.
Leave a Reply
for more info on our strategy
go now →
for more info on our strategy
go now →
VIEW CHILTON'S LATEST
Media Features
go now →
Contact Us
READ THE LATEST
REIT Outlook
go now →


